Houma vs Indonesian 10th Grade
COMPARE
Houma
Indonesian
10th Grade
10th Grade Comparison
Houma
Indonesians
90.2%
10TH GRADE
0.0/ 100
METRIC RATING
320th/ 347
METRIC RANK
91.8%
10TH GRADE
0.0/ 100
METRIC RATING
293rd/ 347
METRIC RANK
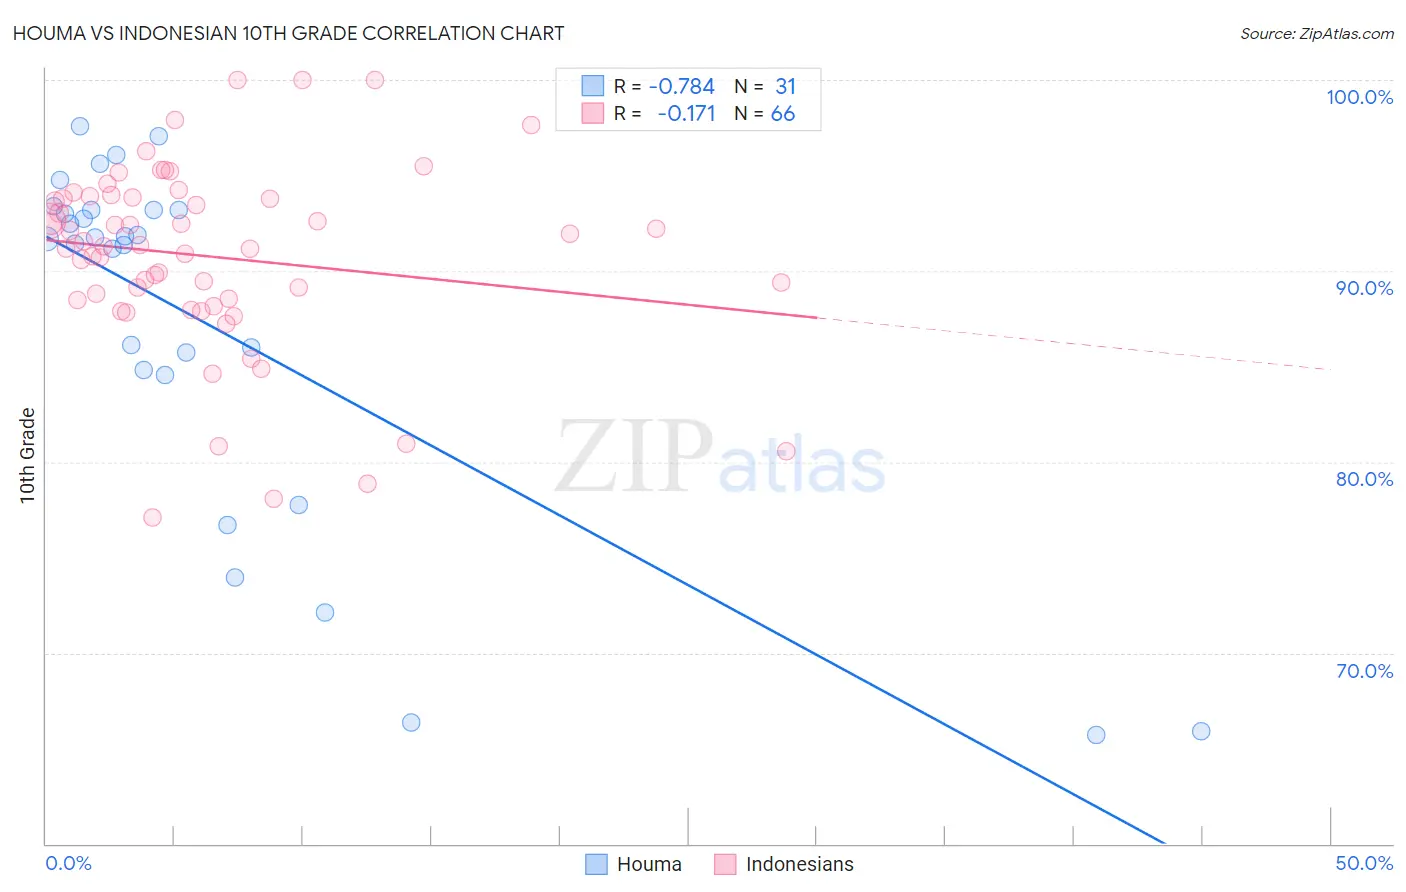
Houma vs Indonesian 10th Grade Correlation Chart
The statistical analysis conducted on geographies consisting of 36,795,916 people shows a strong negative correlation between the proportion of Houma and percentage of population with at least 10th grade education in the United States with a correlation coefficient (R) of -0.784 and weighted average of 90.2%. Similarly, the statistical analysis conducted on geographies consisting of 162,727,113 people shows a poor negative correlation between the proportion of Indonesians and percentage of population with at least 10th grade education in the United States with a correlation coefficient (R) of -0.171 and weighted average of 91.8%, a difference of 1.8%.
10th Grade Correlation Summary
| Measurement | Houma | Indonesian |
| Minimum | 65.7% | 77.1% |
| Maximum | 97.6% | 100.0% |
| Range | 31.9% | 22.9% |
| Mean | 87.1% | 90.7% |
| Median | 91.7% | 91.3% |
| Interquartile 25% (IQ1) | 84.5% | 88.5% |
| Interquartile 75% (IQ3) | 93.2% | 93.9% |
| Interquartile Range (IQR) | 8.6% | 5.4% |
| Standard Deviation (Sample) | 9.6% | 5.0% |
| Standard Deviation (Population) | 9.4% | 4.9% |
Similar Demographics by 10th Grade
Demographics Similar to Houma by 10th Grade
In terms of 10th grade, the demographic groups most similar to Houma are Belizean (90.2%, a difference of 0.0%), Nicaraguan (90.2%, a difference of 0.010%), Tohono O'odham (90.1%, a difference of 0.010%), Immigrants from Cuba (90.2%, a difference of 0.090%), and Immigrants from Belize (90.1%, a difference of 0.11%).
| Demographics | Rating | Rank | 10th Grade |
| Cape Verdeans | 0.0 /100 | #313 | Tragic 90.8% |
| Nepalese | 0.0 /100 | #314 | Tragic 90.7% |
| Immigrants | Caribbean | 0.0 /100 | #315 | Tragic 90.6% |
| Ecuadorians | 0.0 /100 | #316 | Tragic 90.6% |
| Immigrants | Ecuador | 0.0 /100 | #317 | Tragic 90.4% |
| Immigrants | Cuba | 0.0 /100 | #318 | Tragic 90.2% |
| Nicaraguans | 0.0 /100 | #319 | Tragic 90.2% |
| Houma | 0.0 /100 | #320 | Tragic 90.2% |
| Belizeans | 0.0 /100 | #321 | Tragic 90.2% |
| Tohono O'odham | 0.0 /100 | #322 | Tragic 90.1% |
| Immigrants | Belize | 0.0 /100 | #323 | Tragic 90.1% |
| Immigrants | Armenia | 0.0 /100 | #324 | Tragic 89.9% |
| Puerto Ricans | 0.0 /100 | #325 | Tragic 89.8% |
| Central American Indians | 0.0 /100 | #326 | Tragic 89.7% |
| Immigrants | Nicaragua | 0.0 /100 | #327 | Tragic 89.5% |
Demographics Similar to Indonesians by 10th Grade
In terms of 10th grade, the demographic groups most similar to Indonesians are Immigrants from West Indies (91.8%, a difference of 0.020%), Immigrants from Burma/Myanmar (91.8%, a difference of 0.020%), British West Indian (91.8%, a difference of 0.030%), Haitian (91.8%, a difference of 0.030%), and Sri Lankan (91.8%, a difference of 0.050%).
| Demographics | Rating | Rank | 10th Grade |
| Yuman | 0.0 /100 | #286 | Tragic 92.0% |
| Pennsylvania Germans | 0.0 /100 | #287 | Tragic 91.9% |
| Immigrants | Laos | 0.0 /100 | #288 | Tragic 91.9% |
| Sri Lankans | 0.0 /100 | #289 | Tragic 91.8% |
| British West Indians | 0.0 /100 | #290 | Tragic 91.8% |
| Immigrants | West Indies | 0.0 /100 | #291 | Tragic 91.8% |
| Immigrants | Burma/Myanmar | 0.0 /100 | #292 | Tragic 91.8% |
| Indonesians | 0.0 /100 | #293 | Tragic 91.8% |
| Haitians | 0.0 /100 | #294 | Tragic 91.8% |
| Lumbee | 0.0 /100 | #295 | Tragic 91.7% |
| Immigrants | Grenada | 0.0 /100 | #296 | Tragic 91.6% |
| Fijians | 0.0 /100 | #297 | Tragic 91.5% |
| Cubans | 0.0 /100 | #298 | Tragic 91.5% |
| Immigrants | Haiti | 0.0 /100 | #299 | Tragic 91.4% |
| Guyanese | 0.0 /100 | #300 | Tragic 91.4% |