Houma vs Immigrants from Dominican Republic 6th Grade
COMPARE
Houma
Immigrants from Dominican Republic
6th Grade
6th Grade Comparison
Houma
Immigrants from Dominican Republic
96.2%
6TH GRADE
0.1/ 100
METRIC RATING
282nd/ 347
METRIC RANK
94.6%
6TH GRADE
0.0/ 100
METRIC RATING
336th/ 347
METRIC RANK
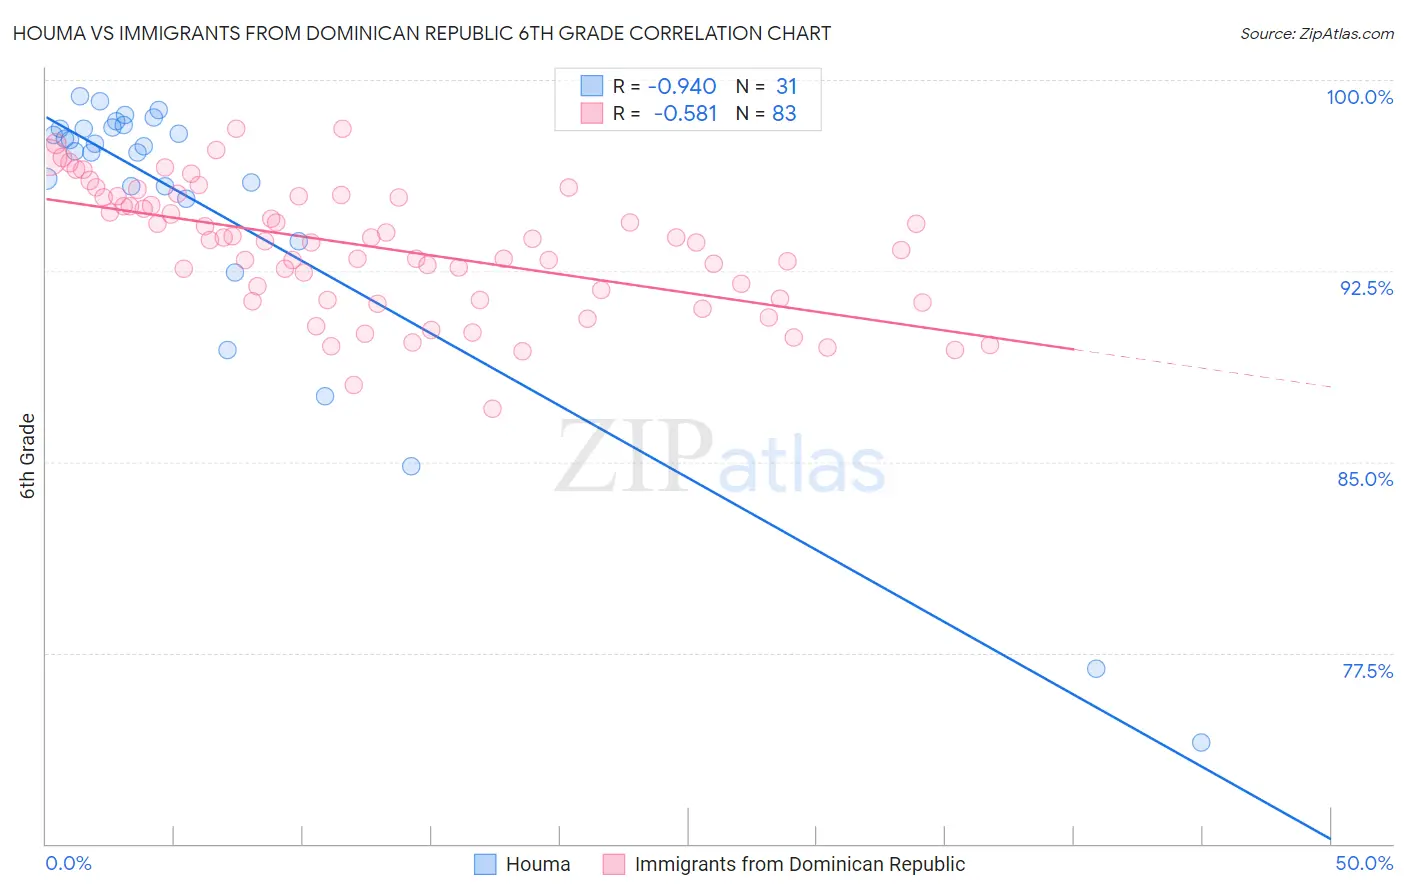
Houma vs Immigrants from Dominican Republic 6th Grade Correlation Chart
The statistical analysis conducted on geographies consisting of 36,795,916 people shows a near-perfect negative correlation between the proportion of Houma and percentage of population with at least 6th grade education in the United States with a correlation coefficient (R) of -0.940 and weighted average of 96.2%. Similarly, the statistical analysis conducted on geographies consisting of 275,144,349 people shows a substantial negative correlation between the proportion of Immigrants from Dominican Republic and percentage of population with at least 6th grade education in the United States with a correlation coefficient (R) of -0.581 and weighted average of 94.6%, a difference of 1.7%.
6th Grade Correlation Summary
| Measurement | Houma | Immigrants from Dominican Republic |
| Minimum | 74.0% | 87.1% |
| Maximum | 99.4% | 98.1% |
| Range | 25.4% | 11.0% |
| Mean | 94.9% | 93.4% |
| Median | 97.4% | 93.6% |
| Interquartile 25% (IQ1) | 95.3% | 91.4% |
| Interquartile 75% (IQ3) | 98.1% | 95.4% |
| Interquartile Range (IQR) | 2.8% | 4.0% |
| Standard Deviation (Sample) | 6.2% | 2.5% |
| Standard Deviation (Population) | 6.1% | 2.5% |
Similar Demographics by 6th Grade
Demographics Similar to Houma by 6th Grade
In terms of 6th grade, the demographic groups most similar to Houma are Immigrants from Peru (96.2%, a difference of 0.0%), Immigrants from Afghanistan (96.2%, a difference of 0.0%), Trinidadian and Tobagonian (96.2%, a difference of 0.0%), Cuban (96.2%, a difference of 0.010%), and Immigrants from Western Africa (96.3%, a difference of 0.020%).
| Demographics | Rating | Rank | 6th Grade |
| Immigrants | Ghana | 0.1 /100 | #275 | Tragic 96.3% |
| Yaqui | 0.1 /100 | #276 | Tragic 96.3% |
| Immigrants | Western Africa | 0.1 /100 | #277 | Tragic 96.3% |
| Immigrants | Thailand | 0.1 /100 | #278 | Tragic 96.3% |
| Immigrants | Peru | 0.1 /100 | #279 | Tragic 96.2% |
| Immigrants | Afghanistan | 0.1 /100 | #280 | Tragic 96.2% |
| Trinidadians and Tobagonians | 0.1 /100 | #281 | Tragic 96.2% |
| Houma | 0.1 /100 | #282 | Tragic 96.2% |
| Cubans | 0.1 /100 | #283 | Tragic 96.2% |
| Fijians | 0.1 /100 | #284 | Tragic 96.2% |
| Somalis | 0.1 /100 | #285 | Tragic 96.2% |
| Barbadians | 0.0 /100 | #286 | Tragic 96.2% |
| Immigrants | Trinidad and Tobago | 0.0 /100 | #287 | Tragic 96.2% |
| Malaysians | 0.0 /100 | #288 | Tragic 96.2% |
| Immigrants | Eritrea | 0.0 /100 | #289 | Tragic 96.1% |
Demographics Similar to Immigrants from Dominican Republic by 6th Grade
In terms of 6th grade, the demographic groups most similar to Immigrants from Dominican Republic are Mexican (94.6%, a difference of 0.020%), Immigrants from the Azores (94.7%, a difference of 0.040%), Immigrants from Latin America (94.7%, a difference of 0.060%), Immigrants from Honduras (94.8%, a difference of 0.14%), and Central American (94.5%, a difference of 0.18%).
| Demographics | Rating | Rank | 6th Grade |
| Dominicans | 0.0 /100 | #329 | Tragic 94.9% |
| Nepalese | 0.0 /100 | #330 | Tragic 94.9% |
| Immigrants | Armenia | 0.0 /100 | #331 | Tragic 94.9% |
| Immigrants | Honduras | 0.0 /100 | #332 | Tragic 94.8% |
| Immigrants | Latin America | 0.0 /100 | #333 | Tragic 94.7% |
| Immigrants | Azores | 0.0 /100 | #334 | Tragic 94.7% |
| Mexicans | 0.0 /100 | #335 | Tragic 94.6% |
| Immigrants | Dominican Republic | 0.0 /100 | #336 | Tragic 94.6% |
| Central Americans | 0.0 /100 | #337 | Tragic 94.5% |
| Immigrants | Cabo Verde | 0.0 /100 | #338 | Tragic 94.4% |
| Yakama | 0.0 /100 | #339 | Tragic 94.3% |
| Guatemalans | 0.0 /100 | #340 | Tragic 94.2% |
| Immigrants | Yemen | 0.0 /100 | #341 | Tragic 94.1% |
| Immigrants | Central America | 0.0 /100 | #342 | Tragic 94.0% |
| Immigrants | Mexico | 0.0 /100 | #343 | Tragic 93.9% |