Houma vs Cambodian 11th Grade
COMPARE
Houma
Cambodian
11th Grade
11th Grade Comparison
Houma
Cambodians
87.0%
11TH GRADE
0.0/ 100
METRIC RATING
334th/ 347
METRIC RANK
93.6%
11TH GRADE
99.2/ 100
METRIC RATING
88th/ 347
METRIC RANK
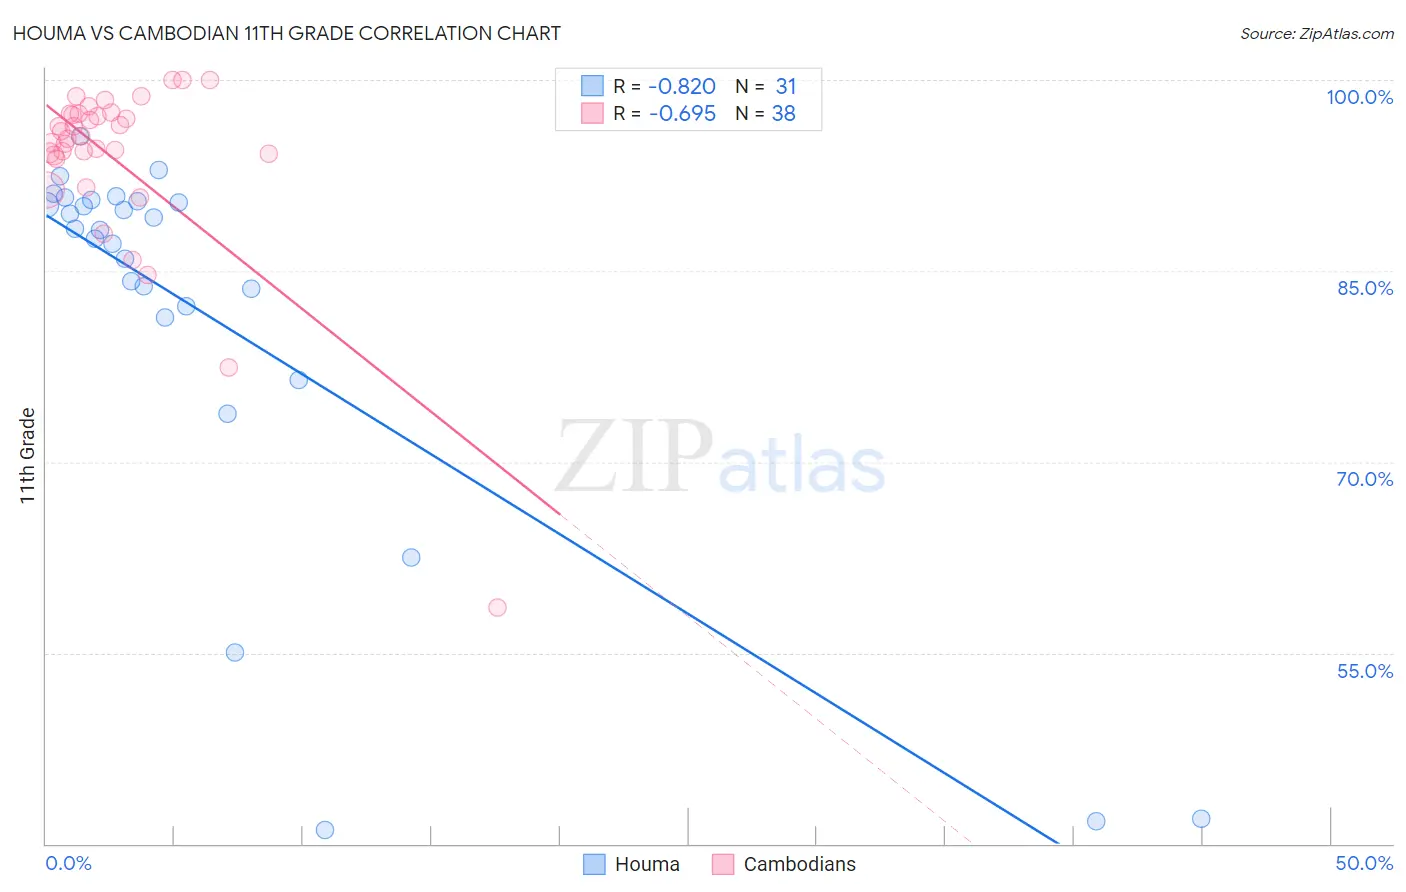
Houma vs Cambodian 11th Grade Correlation Chart
The statistical analysis conducted on geographies consisting of 36,795,916 people shows a very strong negative correlation between the proportion of Houma and percentage of population with at least 11th grade education in the United States with a correlation coefficient (R) of -0.820 and weighted average of 87.0%. Similarly, the statistical analysis conducted on geographies consisting of 102,514,976 people shows a significant negative correlation between the proportion of Cambodians and percentage of population with at least 11th grade education in the United States with a correlation coefficient (R) of -0.695 and weighted average of 93.6%, a difference of 7.6%.
11th Grade Correlation Summary
| Measurement | Houma | Cambodian |
| Minimum | 41.1% | 58.5% |
| Maximum | 95.5% | 100.0% |
| Range | 54.5% | 41.5% |
| Mean | 81.2% | 93.7% |
| Median | 88.2% | 95.5% |
| Interquartile 25% (IQ1) | 81.4% | 94.1% |
| Interquartile 75% (IQ3) | 90.4% | 97.4% |
| Interquartile Range (IQR) | 9.1% | 3.3% |
| Standard Deviation (Sample) | 15.7% | 7.4% |
| Standard Deviation (Population) | 15.5% | 7.3% |
Similar Demographics by 11th Grade
Demographics Similar to Houma by 11th Grade
In terms of 11th grade, the demographic groups most similar to Houma are Immigrants from Yemen (87.1%, a difference of 0.060%), Central American (86.9%, a difference of 0.10%), Immigrants from Dominican Republic (86.9%, a difference of 0.14%), Immigrants from Honduras (86.9%, a difference of 0.14%), and Immigrants from the Azores (87.2%, a difference of 0.24%).
| Demographics | Rating | Rank | 11th Grade |
| Immigrants | Cabo Verde | 0.0 /100 | #327 | Tragic 87.6% |
| Tohono O'odham | 0.0 /100 | #328 | Tragic 87.6% |
| Mexican American Indians | 0.0 /100 | #329 | Tragic 87.5% |
| Hondurans | 0.0 /100 | #330 | Tragic 87.4% |
| Hispanics or Latinos | 0.0 /100 | #331 | Tragic 87.3% |
| Immigrants | Azores | 0.0 /100 | #332 | Tragic 87.2% |
| Immigrants | Yemen | 0.0 /100 | #333 | Tragic 87.1% |
| Houma | 0.0 /100 | #334 | Tragic 87.0% |
| Central Americans | 0.0 /100 | #335 | Tragic 86.9% |
| Immigrants | Dominican Republic | 0.0 /100 | #336 | Tragic 86.9% |
| Immigrants | Honduras | 0.0 /100 | #337 | Tragic 86.9% |
| Immigrants | Latin America | 0.0 /100 | #338 | Tragic 86.8% |
| Guatemalans | 0.0 /100 | #339 | Tragic 86.4% |
| Salvadorans | 0.0 /100 | #340 | Tragic 86.2% |
| Mexicans | 0.0 /100 | #341 | Tragic 86.1% |
Demographics Similar to Cambodians by 11th Grade
In terms of 11th grade, the demographic groups most similar to Cambodians are Immigrants from South Central Asia (93.6%, a difference of 0.0%), Immigrants from Western Europe (93.6%, a difference of 0.0%), Burmese (93.6%, a difference of 0.0%), Immigrants from Switzerland (93.6%, a difference of 0.010%), and Ottawa (93.6%, a difference of 0.010%).
| Demographics | Rating | Rank | 11th Grade |
| Immigrants | Moldova | 99.5 /100 | #81 | Exceptional 93.7% |
| Immigrants | Saudi Arabia | 99.3 /100 | #82 | Exceptional 93.7% |
| Icelanders | 99.3 /100 | #83 | Exceptional 93.6% |
| Immigrants | Taiwan | 99.3 /100 | #84 | Exceptional 93.6% |
| Immigrants | Switzerland | 99.3 /100 | #85 | Exceptional 93.6% |
| Immigrants | South Central Asia | 99.2 /100 | #86 | Exceptional 93.6% |
| Immigrants | Western Europe | 99.2 /100 | #87 | Exceptional 93.6% |
| Cambodians | 99.2 /100 | #88 | Exceptional 93.6% |
| Burmese | 99.2 /100 | #89 | Exceptional 93.6% |
| Ottawa | 99.2 /100 | #90 | Exceptional 93.6% |
| South Africans | 99.2 /100 | #91 | Exceptional 93.6% |
| Immigrants | Bulgaria | 99.1 /100 | #92 | Exceptional 93.6% |
| Puget Sound Salish | 99.1 /100 | #93 | Exceptional 93.6% |
| Swiss | 99.0 /100 | #94 | Exceptional 93.6% |
| Immigrants | France | 99.0 /100 | #95 | Exceptional 93.6% |