Houma vs Bhutanese 4th Grade
COMPARE
Houma
Bhutanese
4th Grade
4th Grade Comparison
Houma
Bhutanese
96.8%
4TH GRADE
0.0/ 100
METRIC RATING
287th/ 347
METRIC RANK
97.9%
4TH GRADE
97.4/ 100
METRIC RATING
107th/ 347
METRIC RANK
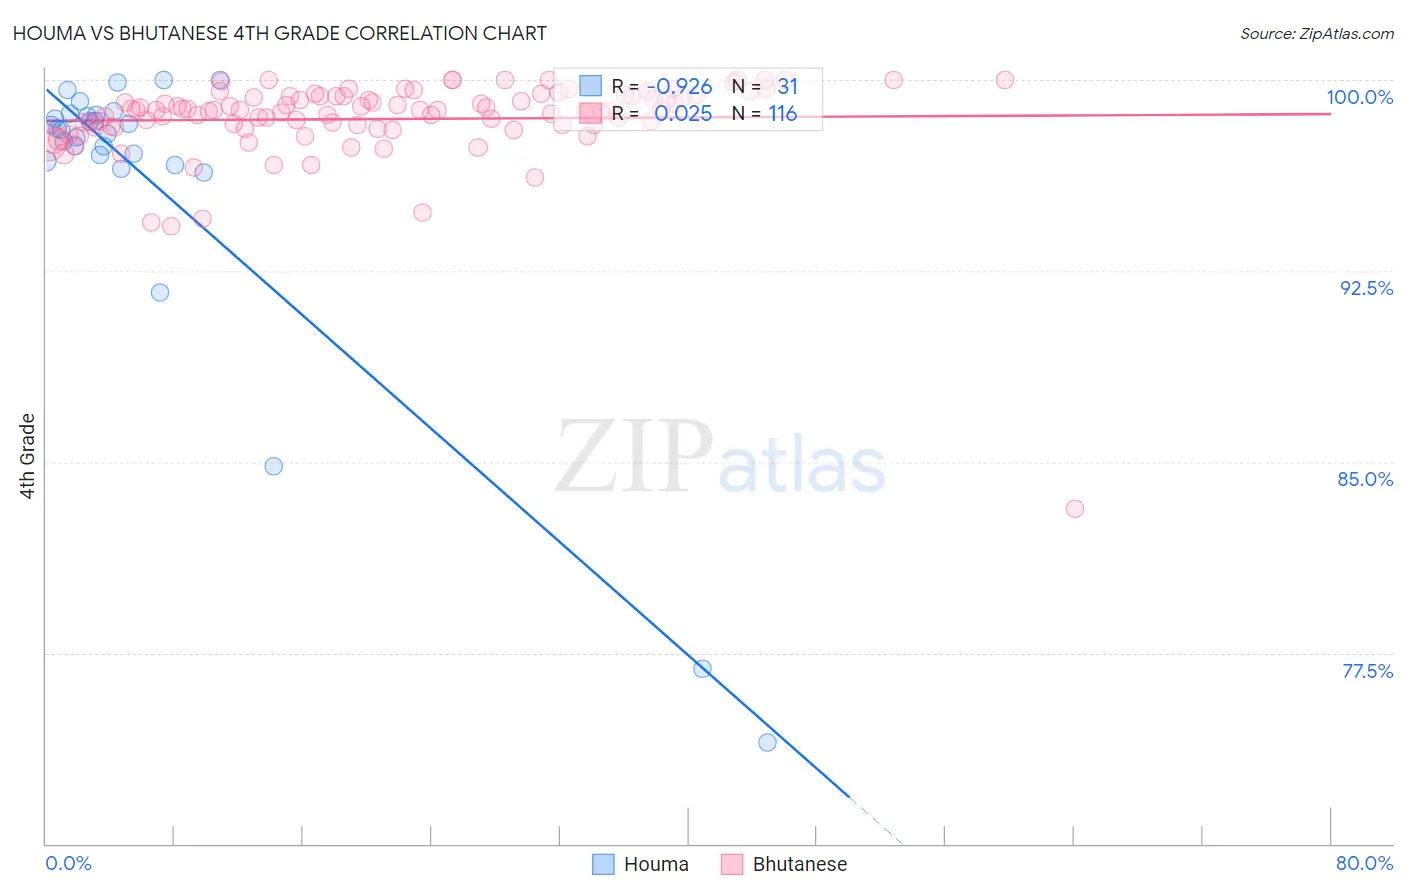
Houma vs Bhutanese 4th Grade Correlation Chart
The statistical analysis conducted on geographies consisting of 36,795,916 people shows a near-perfect negative correlation between the proportion of Houma and percentage of population with at least 4th grade education in the United States with a correlation coefficient (R) of -0.926 and weighted average of 96.8%. Similarly, the statistical analysis conducted on geographies consisting of 455,591,134 people shows no correlation between the proportion of Bhutanese and percentage of population with at least 4th grade education in the United States with a correlation coefficient (R) of 0.025 and weighted average of 97.9%, a difference of 1.1%.
4th Grade Correlation Summary
| Measurement | Houma | Bhutanese |
| Minimum | 74.0% | 83.2% |
| Maximum | 100.0% | 100.0% |
| Range | 26.0% | 16.8% |
| Mean | 96.0% | 98.5% |
| Median | 98.1% | 98.8% |
| Interquartile 25% (IQ1) | 96.8% | 98.2% |
| Interquartile 75% (IQ3) | 98.6% | 99.4% |
| Interquartile Range (IQR) | 1.8% | 1.2% |
| Standard Deviation (Sample) | 6.2% | 1.8% |
| Standard Deviation (Population) | 6.1% | 1.8% |
Similar Demographics by 4th Grade
Demographics Similar to Houma by 4th Grade
In terms of 4th grade, the demographic groups most similar to Houma are Immigrants from Afghanistan (96.8%, a difference of 0.0%), Immigrants from West Indies (96.7%, a difference of 0.020%), British West Indian (96.7%, a difference of 0.030%), Immigrants from Barbados (96.8%, a difference of 0.040%), and Immigrants from Thailand (96.8%, a difference of 0.040%).
| Demographics | Rating | Rank | 4th Grade |
| Barbadians | 0.1 /100 | #280 | Tragic 96.9% |
| Immigrants | Hong Kong | 0.1 /100 | #281 | Tragic 96.9% |
| Immigrants | Trinidad and Tobago | 0.1 /100 | #282 | Tragic 96.8% |
| Immigrants | Philippines | 0.1 /100 | #283 | Tragic 96.8% |
| Immigrants | St. Vincent and the Grenadines | 0.1 /100 | #284 | Tragic 96.8% |
| Immigrants | Barbados | 0.0 /100 | #285 | Tragic 96.8% |
| Immigrants | Thailand | 0.0 /100 | #286 | Tragic 96.8% |
| Houma | 0.0 /100 | #287 | Tragic 96.8% |
| Immigrants | Afghanistan | 0.0 /100 | #288 | Tragic 96.8% |
| Immigrants | West Indies | 0.0 /100 | #289 | Tragic 96.7% |
| British West Indians | 0.0 /100 | #290 | Tragic 96.7% |
| Immigrants | Grenada | 0.0 /100 | #291 | Tragic 96.7% |
| Malaysians | 0.0 /100 | #292 | Tragic 96.7% |
| Puerto Ricans | 0.0 /100 | #293 | Tragic 96.7% |
| Immigrants | Eritrea | 0.0 /100 | #294 | Tragic 96.7% |
Demographics Similar to Bhutanese by 4th Grade
In terms of 4th grade, the demographic groups most similar to Bhutanese are Immigrants from Czechoslovakia (97.9%, a difference of 0.0%), Immigrants from Singapore (97.9%, a difference of 0.0%), Puget Sound Salish (97.9%, a difference of 0.010%), Nonimmigrants (97.9%, a difference of 0.010%), and German Russian (97.9%, a difference of 0.010%).
| Demographics | Rating | Rank | 4th Grade |
| Yugoslavians | 98.1 /100 | #100 | Exceptional 97.9% |
| Cree | 98.1 /100 | #101 | Exceptional 97.9% |
| Choctaw | 97.9 /100 | #102 | Exceptional 97.9% |
| Puget Sound Salish | 97.7 /100 | #103 | Exceptional 97.9% |
| Immigrants | Nonimmigrants | 97.5 /100 | #104 | Exceptional 97.9% |
| German Russians | 97.5 /100 | #105 | Exceptional 97.9% |
| Immigrants | Czechoslovakia | 97.5 /100 | #106 | Exceptional 97.9% |
| Bhutanese | 97.4 /100 | #107 | Exceptional 97.9% |
| Immigrants | Singapore | 97.3 /100 | #108 | Exceptional 97.9% |
| Immigrants | Latvia | 96.8 /100 | #109 | Exceptional 97.8% |
| Thais | 96.7 /100 | #110 | Exceptional 97.8% |
| Immigrants | Switzerland | 96.1 /100 | #111 | Exceptional 97.8% |
| Okinawans | 96.0 /100 | #112 | Exceptional 97.8% |
| Basques | 95.8 /100 | #113 | Exceptional 97.8% |
| Iroquois | 95.4 /100 | #114 | Exceptional 97.8% |