Hopi vs Immigrants from Iraq Nursery School
COMPARE
Hopi
Immigrants from Iraq
Nursery School
Nursery School Comparison
Hopi
Immigrants from Iraq
98.3%
NURSERY SCHOOL
98.9/ 100
METRIC RATING
87th/ 347
METRIC RANK
97.6%
NURSERY SCHOOL
0.7/ 100
METRIC RATING
253rd/ 347
METRIC RANK
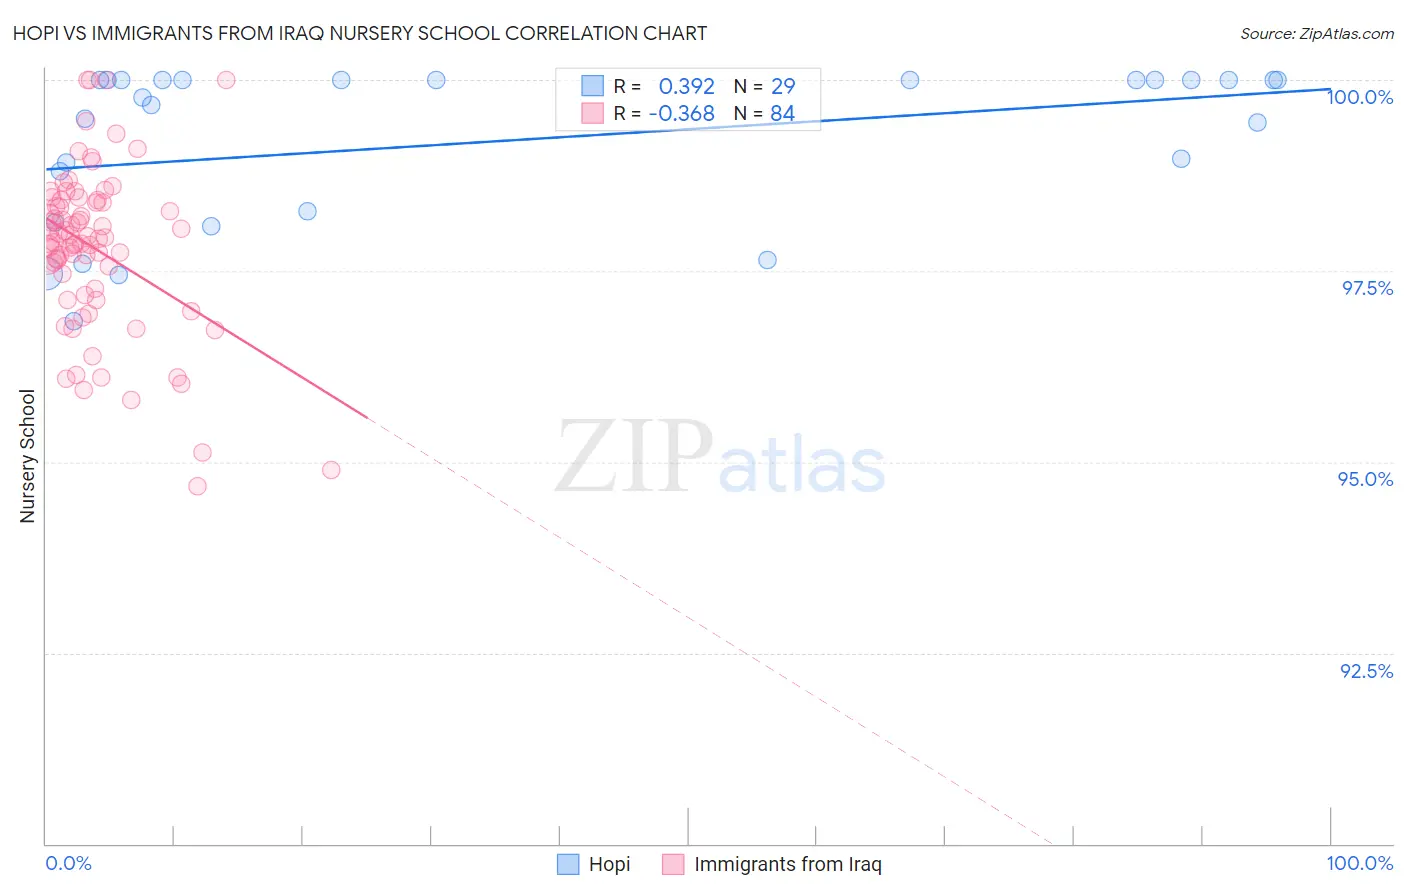
Hopi vs Immigrants from Iraq Nursery School Correlation Chart
The statistical analysis conducted on geographies consisting of 74,739,957 people shows a mild positive correlation between the proportion of Hopi and percentage of population with at least nursery school education in the United States with a correlation coefficient (R) of 0.392 and weighted average of 98.3%. Similarly, the statistical analysis conducted on geographies consisting of 194,726,982 people shows a mild negative correlation between the proportion of Immigrants from Iraq and percentage of population with at least nursery school education in the United States with a correlation coefficient (R) of -0.368 and weighted average of 97.6%, a difference of 0.71%.
Nursery School Correlation Summary
| Measurement | Hopi | Immigrants from Iraq |
| Minimum | 96.8% | 94.7% |
| Maximum | 100.0% | 100.0% |
| Range | 3.2% | 5.3% |
| Mean | 99.2% | 97.8% |
| Median | 99.8% | 97.9% |
| Interquartile 25% (IQ1) | 98.2% | 97.2% |
| Interquartile 75% (IQ3) | 100.0% | 98.4% |
| Interquartile Range (IQR) | 1.8% | 1.2% |
| Standard Deviation (Sample) | 1.0% | 1.1% |
| Standard Deviation (Population) | 1.0% | 1.1% |
Similar Demographics by Nursery School
Demographics Similar to Hopi by Nursery School
In terms of nursery school, the demographic groups most similar to Hopi are Ukrainian (98.3%, a difference of 0.0%), Immigrants from South Africa (98.3%, a difference of 0.0%), Immigrants from Western Europe (98.3%, a difference of 0.0%), Zimbabwean (98.3%, a difference of 0.0%), and Immigrants from Australia (98.3%, a difference of 0.010%).
| Demographics | Rating | Rank | Nursery School |
| Shoshone | 99.3 /100 | #80 | Exceptional 98.3% |
| Icelanders | 99.2 /100 | #81 | Exceptional 98.3% |
| Potawatomi | 99.2 /100 | #82 | Exceptional 98.3% |
| Osage | 99.1 /100 | #83 | Exceptional 98.3% |
| Immigrants | Denmark | 99.1 /100 | #84 | Exceptional 98.3% |
| Immigrants | Sweden | 99.1 /100 | #85 | Exceptional 98.3% |
| Immigrants | Australia | 99.0 /100 | #86 | Exceptional 98.3% |
| Hopi | 98.9 /100 | #87 | Exceptional 98.3% |
| Ukrainians | 98.9 /100 | #88 | Exceptional 98.3% |
| Immigrants | South Africa | 98.8 /100 | #89 | Exceptional 98.3% |
| Immigrants | Western Europe | 98.8 /100 | #90 | Exceptional 98.3% |
| Zimbabweans | 98.8 /100 | #91 | Exceptional 98.3% |
| Macedonians | 98.7 /100 | #92 | Exceptional 98.3% |
| Immigrants | India | 98.7 /100 | #93 | Exceptional 98.3% |
| Immigrants | Germany | 98.6 /100 | #94 | Exceptional 98.3% |
Demographics Similar to Immigrants from Iraq by Nursery School
In terms of nursery school, the demographic groups most similar to Immigrants from Iraq are Immigrants from Africa (97.6%, a difference of 0.0%), Immigrants from Congo (97.6%, a difference of 0.0%), Immigrants from Senegal (97.6%, a difference of 0.010%), Ethiopian (97.6%, a difference of 0.010%), and Immigrants from Asia (97.6%, a difference of 0.010%).
| Demographics | Rating | Rank | Nursery School |
| Peruvians | 1.0 /100 | #246 | Tragic 97.6% |
| Immigrants | Middle Africa | 0.9 /100 | #247 | Tragic 97.6% |
| Indians (Asian) | 0.9 /100 | #248 | Tragic 97.6% |
| Immigrants | Eastern Africa | 0.9 /100 | #249 | Tragic 97.6% |
| Immigrants | Senegal | 0.9 /100 | #250 | Tragic 97.6% |
| Ethiopians | 0.8 /100 | #251 | Tragic 97.6% |
| Immigrants | Africa | 0.8 /100 | #252 | Tragic 97.6% |
| Immigrants | Iraq | 0.7 /100 | #253 | Tragic 97.6% |
| Immigrants | Congo | 0.7 /100 | #254 | Tragic 97.6% |
| Immigrants | Asia | 0.7 /100 | #255 | Tragic 97.6% |
| Yaqui | 0.6 /100 | #256 | Tragic 97.6% |
| Immigrants | Colombia | 0.6 /100 | #257 | Tragic 97.6% |
| Jamaicans | 0.6 /100 | #258 | Tragic 97.6% |
| Armenians | 0.4 /100 | #259 | Tragic 97.6% |
| Immigrants | South America | 0.4 /100 | #260 | Tragic 97.6% |