Honduran vs Immigrants from Jamaica 11th Grade
COMPARE
Honduran
Immigrants from Jamaica
11th Grade
11th Grade Comparison
Hondurans
Immigrants from Jamaica
87.4%
11TH GRADE
0.0/ 100
METRIC RATING
330th/ 347
METRIC RANK
91.2%
11TH GRADE
0.3/ 100
METRIC RATING
267th/ 347
METRIC RANK
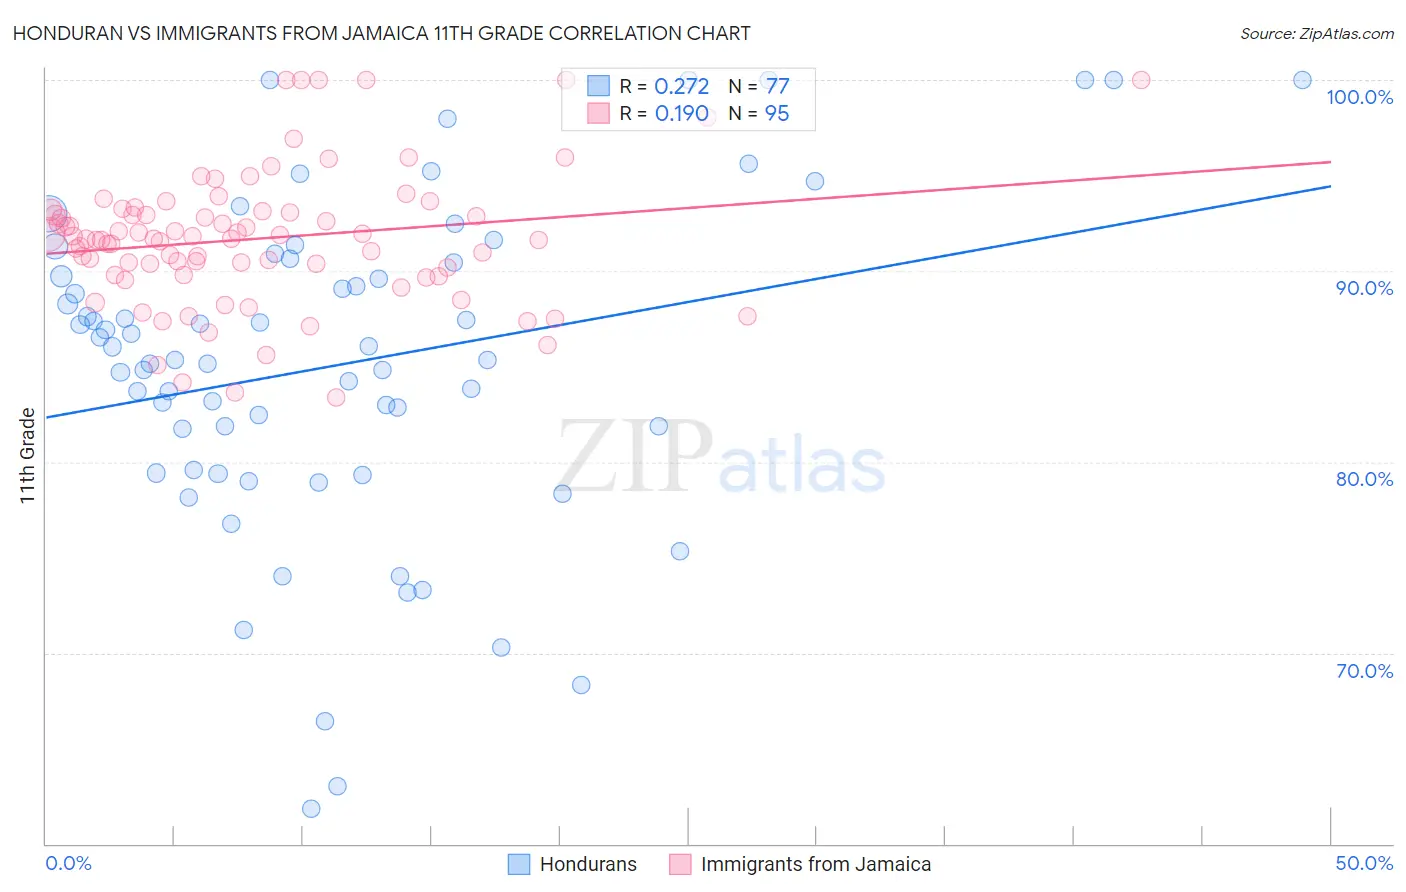
Honduran vs Immigrants from Jamaica 11th Grade Correlation Chart
The statistical analysis conducted on geographies consisting of 357,858,827 people shows a weak positive correlation between the proportion of Hondurans and percentage of population with at least 11th grade education in the United States with a correlation coefficient (R) of 0.272 and weighted average of 87.4%. Similarly, the statistical analysis conducted on geographies consisting of 301,829,550 people shows a poor positive correlation between the proportion of Immigrants from Jamaica and percentage of population with at least 11th grade education in the United States with a correlation coefficient (R) of 0.190 and weighted average of 91.2%, a difference of 4.4%.
11th Grade Correlation Summary
| Measurement | Honduran | Immigrants from Jamaica |
| Minimum | 61.9% | 83.4% |
| Maximum | 100.0% | 100.0% |
| Range | 38.1% | 16.6% |
| Mean | 85.1% | 91.7% |
| Median | 85.4% | 91.7% |
| Interquartile 25% (IQ1) | 79.5% | 89.8% |
| Interquartile 75% (IQ3) | 90.5% | 93.2% |
| Interquartile Range (IQR) | 11.0% | 3.4% |
| Standard Deviation (Sample) | 8.6% | 3.5% |
| Standard Deviation (Population) | 8.5% | 3.5% |
Similar Demographics by 11th Grade
Demographics Similar to Hondurans by 11th Grade
In terms of 11th grade, the demographic groups most similar to Hondurans are Hispanic or Latino (87.3%, a difference of 0.060%), Immigrants from the Azores (87.2%, a difference of 0.16%), Mexican American Indian (87.5%, a difference of 0.19%), Tohono O'odham (87.6%, a difference of 0.26%), and Immigrants from Cabo Verde (87.6%, a difference of 0.31%).
| Demographics | Rating | Rank | 11th Grade |
| Pima | 0.0 /100 | #323 | Tragic 88.3% |
| Central American Indians | 0.0 /100 | #324 | Tragic 88.2% |
| Immigrants | Nicaragua | 0.0 /100 | #325 | Tragic 88.1% |
| Dominicans | 0.0 /100 | #326 | Tragic 87.7% |
| Immigrants | Cabo Verde | 0.0 /100 | #327 | Tragic 87.6% |
| Tohono O'odham | 0.0 /100 | #328 | Tragic 87.6% |
| Mexican American Indians | 0.0 /100 | #329 | Tragic 87.5% |
| Hondurans | 0.0 /100 | #330 | Tragic 87.4% |
| Hispanics or Latinos | 0.0 /100 | #331 | Tragic 87.3% |
| Immigrants | Azores | 0.0 /100 | #332 | Tragic 87.2% |
| Immigrants | Yemen | 0.0 /100 | #333 | Tragic 87.1% |
| Houma | 0.0 /100 | #334 | Tragic 87.0% |
| Central Americans | 0.0 /100 | #335 | Tragic 86.9% |
| Immigrants | Dominican Republic | 0.0 /100 | #336 | Tragic 86.9% |
| Immigrants | Honduras | 0.0 /100 | #337 | Tragic 86.9% |
Demographics Similar to Immigrants from Jamaica by 11th Grade
In terms of 11th grade, the demographic groups most similar to Immigrants from Jamaica are Immigrants from Western Africa (91.2%, a difference of 0.010%), Yup'ik (91.2%, a difference of 0.030%), Pueblo (91.2%, a difference of 0.030%), Immigrants from Ghana (91.2%, a difference of 0.050%), and U.S. Virgin Islander (91.1%, a difference of 0.070%).
| Demographics | Rating | Rank | 11th Grade |
| Spanish Americans | 0.6 /100 | #260 | Tragic 91.4% |
| Taiwanese | 0.6 /100 | #261 | Tragic 91.3% |
| Immigrants | Uruguay | 0.5 /100 | #262 | Tragic 91.3% |
| Immigrants | Ghana | 0.3 /100 | #263 | Tragic 91.2% |
| Yup'ik | 0.3 /100 | #264 | Tragic 91.2% |
| Pueblo | 0.3 /100 | #265 | Tragic 91.2% |
| Immigrants | Western Africa | 0.3 /100 | #266 | Tragic 91.2% |
| Immigrants | Jamaica | 0.3 /100 | #267 | Tragic 91.2% |
| U.S. Virgin Islanders | 0.2 /100 | #268 | Tragic 91.1% |
| Ute | 0.2 /100 | #269 | Tragic 91.1% |
| Trinidadians and Tobagonians | 0.2 /100 | #270 | Tragic 91.1% |
| Immigrants | Peru | 0.1 /100 | #271 | Tragic 91.0% |
| West Indians | 0.1 /100 | #272 | Tragic 91.0% |
| Paiute | 0.1 /100 | #273 | Tragic 91.0% |
| Immigrants | Trinidad and Tobago | 0.1 /100 | #274 | Tragic 90.9% |