Honduran vs Immigrants from Eastern Africa 4th Grade
COMPARE
Honduran
Immigrants from Eastern Africa
4th Grade
4th Grade Comparison
Hondurans
Immigrants from Eastern Africa
96.0%
4TH GRADE
0.0/ 100
METRIC RATING
327th/ 347
METRIC RANK
97.1%
4TH GRADE
1.2/ 100
METRIC RATING
245th/ 347
METRIC RANK
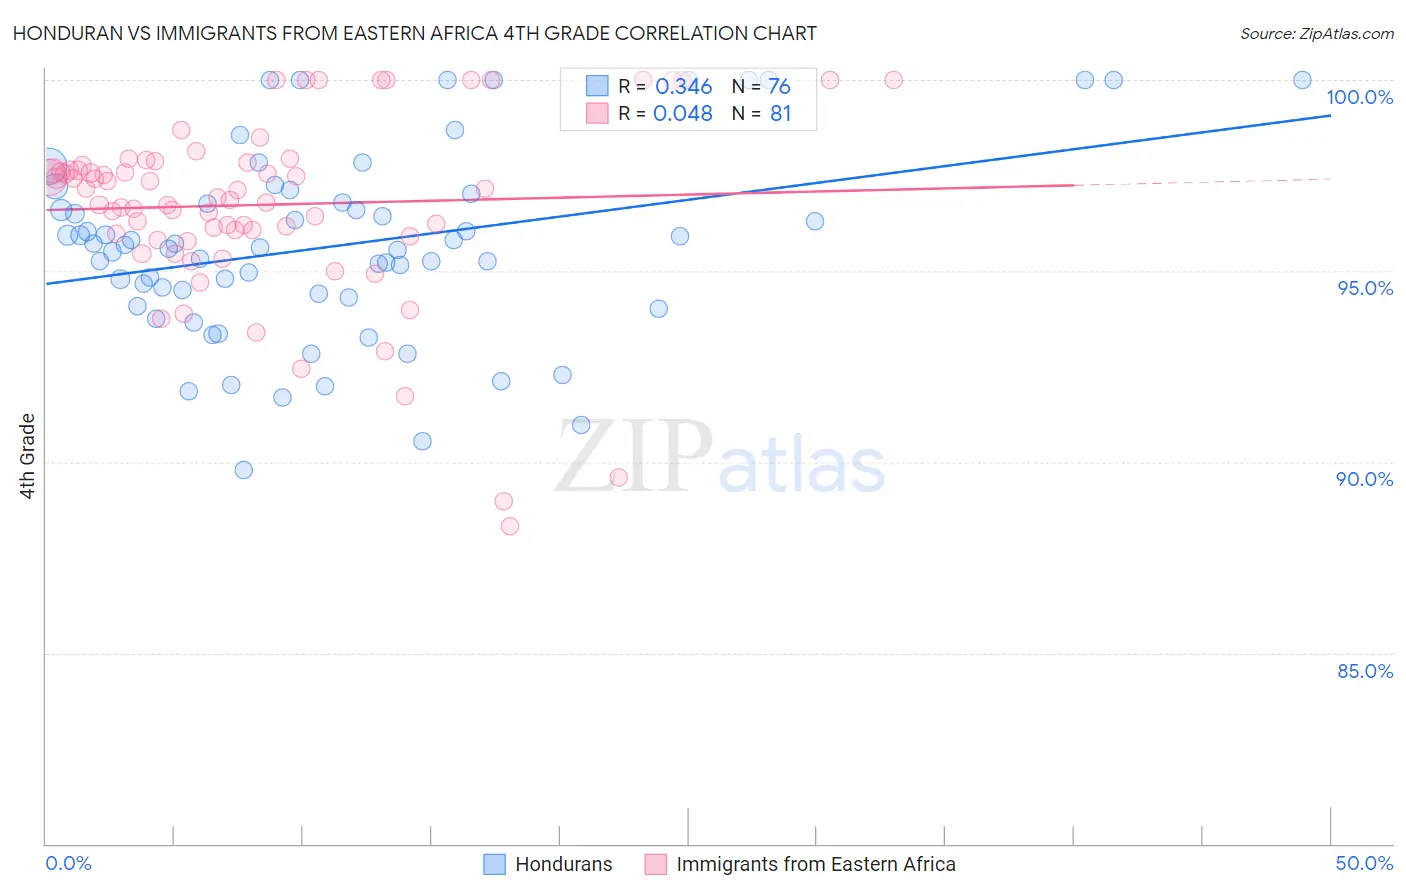
Honduran vs Immigrants from Eastern Africa 4th Grade Correlation Chart
The statistical analysis conducted on geographies consisting of 357,784,803 people shows a mild positive correlation between the proportion of Hondurans and percentage of population with at least 4th grade education in the United States with a correlation coefficient (R) of 0.346 and weighted average of 96.0%. Similarly, the statistical analysis conducted on geographies consisting of 355,144,184 people shows no correlation between the proportion of Immigrants from Eastern Africa and percentage of population with at least 4th grade education in the United States with a correlation coefficient (R) of 0.048 and weighted average of 97.1%, a difference of 1.2%.
4th Grade Correlation Summary
| Measurement | Honduran | Immigrants from Eastern Africa |
| Minimum | 89.8% | 88.3% |
| Maximum | 100.0% | 100.0% |
| Range | 10.2% | 11.7% |
| Mean | 95.7% | 96.7% |
| Median | 95.7% | 97.1% |
| Interquartile 25% (IQ1) | 94.4% | 95.9% |
| Interquartile 75% (IQ3) | 96.9% | 97.8% |
| Interquartile Range (IQR) | 2.6% | 1.9% |
| Standard Deviation (Sample) | 2.5% | 2.4% |
| Standard Deviation (Population) | 2.4% | 2.4% |
Similar Demographics by 4th Grade
Demographics Similar to Hondurans by 4th Grade
In terms of 4th grade, the demographic groups most similar to Hondurans are Dominican (96.0%, a difference of 0.020%), Hispanic or Latino (96.0%, a difference of 0.020%), Immigrants from Belize (96.0%, a difference of 0.030%), Immigrants from Nicaragua (96.0%, a difference of 0.040%), and Japanese (96.0%, a difference of 0.060%).
| Demographics | Rating | Rank | 4th Grade |
| Bangladeshis | 0.0 /100 | #320 | Tragic 96.1% |
| Japanese | 0.0 /100 | #321 | Tragic 96.0% |
| Immigrants | Vietnam | 0.0 /100 | #322 | Tragic 96.0% |
| Immigrants | Nicaragua | 0.0 /100 | #323 | Tragic 96.0% |
| Immigrants | Belize | 0.0 /100 | #324 | Tragic 96.0% |
| Dominicans | 0.0 /100 | #325 | Tragic 96.0% |
| Hispanics or Latinos | 0.0 /100 | #326 | Tragic 96.0% |
| Hondurans | 0.0 /100 | #327 | Tragic 96.0% |
| Mexican American Indians | 0.0 /100 | #328 | Tragic 95.8% |
| Immigrants | Cambodia | 0.0 /100 | #329 | Tragic 95.8% |
| Immigrants | Fiji | 0.0 /100 | #330 | Tragic 95.8% |
| Immigrants | Armenia | 0.0 /100 | #331 | Tragic 95.8% |
| Immigrants | Honduras | 0.0 /100 | #332 | Tragic 95.8% |
| Immigrants | Dominican Republic | 0.0 /100 | #333 | Tragic 95.7% |
| Immigrants | Cabo Verde | 0.0 /100 | #334 | Tragic 95.7% |
Demographics Similar to Immigrants from Eastern Africa by 4th Grade
In terms of 4th grade, the demographic groups most similar to Immigrants from Eastern Africa are Korean (97.1%, a difference of 0.0%), Immigrants from Uruguay (97.1%, a difference of 0.0%), Ethiopian (97.1%, a difference of 0.0%), Asian (97.1%, a difference of 0.010%), and U.S. Virgin Islander (97.1%, a difference of 0.010%).
| Demographics | Rating | Rank | 4th Grade |
| Indians (Asian) | 1.9 /100 | #238 | Tragic 97.2% |
| Nigerians | 1.8 /100 | #239 | Tragic 97.1% |
| Colombians | 1.6 /100 | #240 | Tragic 97.1% |
| Immigrants | Indonesia | 1.5 /100 | #241 | Tragic 97.1% |
| Asians | 1.4 /100 | #242 | Tragic 97.1% |
| U.S. Virgin Islanders | 1.4 /100 | #243 | Tragic 97.1% |
| Koreans | 1.3 /100 | #244 | Tragic 97.1% |
| Immigrants | Eastern Africa | 1.2 /100 | #245 | Tragic 97.1% |
| Immigrants | Uruguay | 1.2 /100 | #246 | Tragic 97.1% |
| Ethiopians | 1.2 /100 | #247 | Tragic 97.1% |
| Immigrants | Asia | 1.2 /100 | #248 | Tragic 97.1% |
| Immigrants | Africa | 1.0 /100 | #249 | Tragic 97.1% |
| Immigrants | Senegal | 0.9 /100 | #250 | Tragic 97.1% |
| South Americans | 0.8 /100 | #251 | Tragic 97.1% |
| Jamaicans | 0.8 /100 | #252 | Tragic 97.1% |