Honduran vs Immigrants from Congo College, 1 year or more
COMPARE
Honduran
Immigrants from Congo
College, 1 year or more
College, 1 year or more Comparison
Hondurans
Immigrants from Congo
51.6%
COLLEGE, 1 YEAR OR MORE
0.0/ 100
METRIC RATING
310th/ 347
METRIC RANK
55.6%
COLLEGE, 1 YEAR OR MORE
0.8/ 100
METRIC RATING
248th/ 347
METRIC RANK
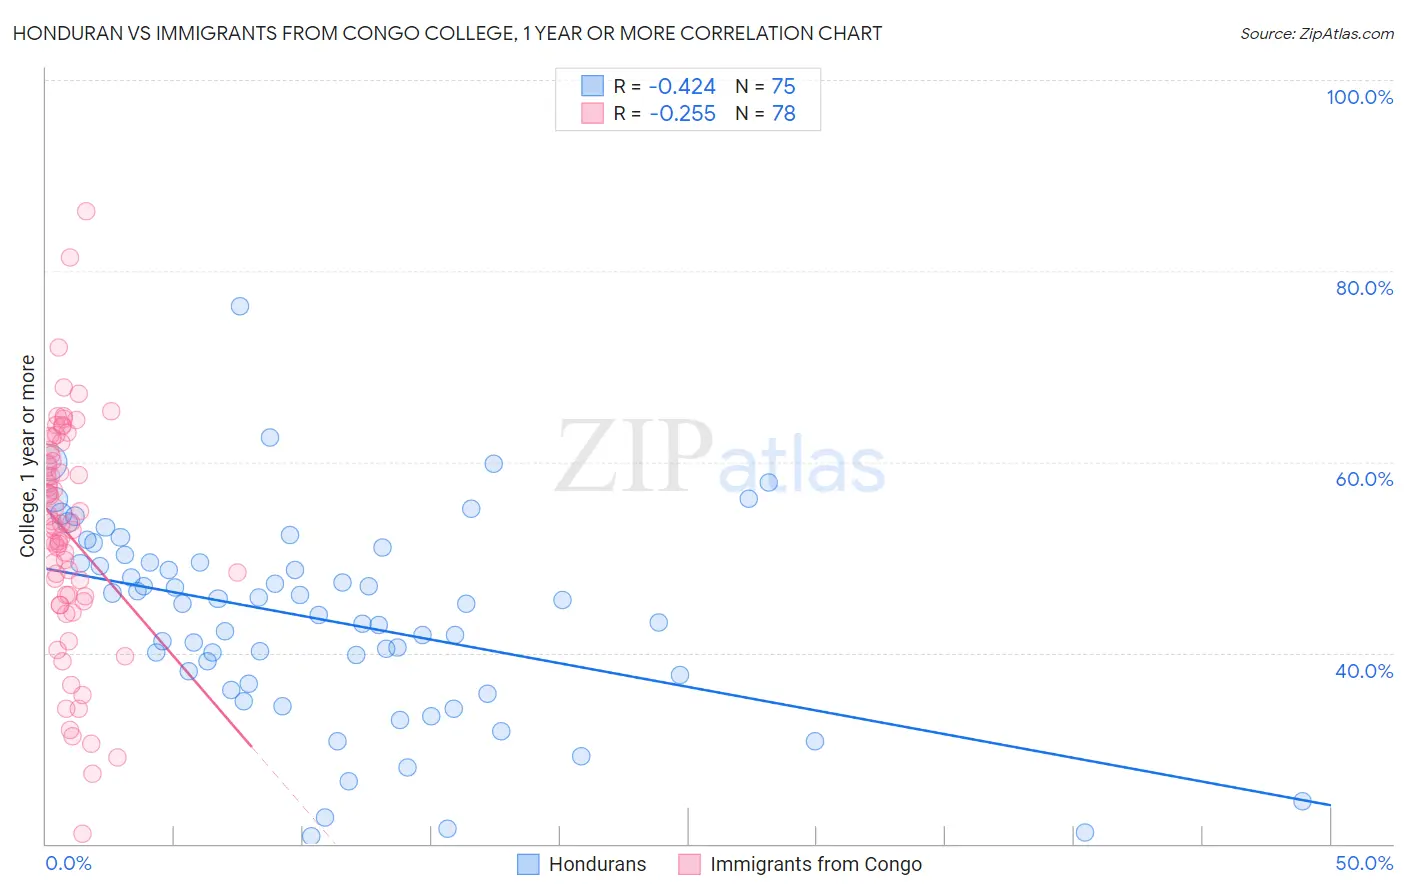
Honduran vs Immigrants from Congo College, 1 year or more Correlation Chart
The statistical analysis conducted on geographies consisting of 357,855,848 people shows a moderate negative correlation between the proportion of Hondurans and percentage of population with at least college, 1 year or more education in the United States with a correlation coefficient (R) of -0.424 and weighted average of 51.6%. Similarly, the statistical analysis conducted on geographies consisting of 92,129,670 people shows a weak negative correlation between the proportion of Immigrants from Congo and percentage of population with at least college, 1 year or more education in the United States with a correlation coefficient (R) of -0.255 and weighted average of 55.6%, a difference of 7.7%.
College, 1 year or more Correlation Summary
| Measurement | Honduran | Immigrants from Congo |
| Minimum | 20.7% | 21.1% |
| Maximum | 76.3% | 86.2% |
| Range | 55.6% | 65.2% |
| Mean | 43.4% | 52.5% |
| Median | 45.1% | 53.4% |
| Interquartile 25% (IQ1) | 36.7% | 46.0% |
| Interquartile 75% (IQ3) | 49.5% | 60.7% |
| Interquartile Range (IQR) | 12.8% | 14.7% |
| Standard Deviation (Sample) | 10.4% | 11.9% |
| Standard Deviation (Population) | 10.4% | 11.8% |
Similar Demographics by College, 1 year or more
Demographics Similar to Hondurans by College, 1 year or more
In terms of college, 1 year or more, the demographic groups most similar to Hondurans are Immigrants from Haiti (51.5%, a difference of 0.16%), Pueblo (51.5%, a difference of 0.20%), Immigrants from Caribbean (51.4%, a difference of 0.33%), Apache (51.8%, a difference of 0.39%), and Salvadoran (51.8%, a difference of 0.40%).
| Demographics | Rating | Rank | College, 1 year or more |
| Creek | 0.0 /100 | #303 | Tragic 52.2% |
| Central Americans | 0.0 /100 | #304 | Tragic 52.1% |
| Seminole | 0.0 /100 | #305 | Tragic 52.1% |
| Mexican American Indians | 0.0 /100 | #306 | Tragic 51.9% |
| Immigrants | Portugal | 0.0 /100 | #307 | Tragic 51.9% |
| Salvadorans | 0.0 /100 | #308 | Tragic 51.8% |
| Apache | 0.0 /100 | #309 | Tragic 51.8% |
| Hondurans | 0.0 /100 | #310 | Tragic 51.6% |
| Immigrants | Haiti | 0.0 /100 | #311 | Tragic 51.5% |
| Pueblo | 0.0 /100 | #312 | Tragic 51.5% |
| Immigrants | Caribbean | 0.0 /100 | #313 | Tragic 51.4% |
| Fijians | 0.0 /100 | #314 | Tragic 51.3% |
| Guatemalans | 0.0 /100 | #315 | Tragic 51.2% |
| Cajuns | 0.0 /100 | #316 | Tragic 51.2% |
| Hispanics or Latinos | 0.0 /100 | #317 | Tragic 51.1% |
Demographics Similar to Immigrants from Congo by College, 1 year or more
In terms of college, 1 year or more, the demographic groups most similar to Immigrants from Congo are Hawaiian (55.6%, a difference of 0.040%), Immigrants from Trinidad and Tobago (55.5%, a difference of 0.10%), Malaysian (55.6%, a difference of 0.11%), Delaware (55.5%, a difference of 0.12%), and Immigrants from Liberia (55.7%, a difference of 0.16%).
| Demographics | Rating | Rank | College, 1 year or more |
| French American Indians | 1.0 /100 | #241 | Tragic 55.8% |
| Marshallese | 1.0 /100 | #242 | Tragic 55.8% |
| Osage | 1.0 /100 | #243 | Tragic 55.8% |
| Chippewa | 0.9 /100 | #244 | Tragic 55.7% |
| Immigrants | Liberia | 0.8 /100 | #245 | Tragic 55.7% |
| Malaysians | 0.8 /100 | #246 | Tragic 55.6% |
| Hawaiians | 0.8 /100 | #247 | Tragic 55.6% |
| Immigrants | Congo | 0.8 /100 | #248 | Tragic 55.6% |
| Immigrants | Trinidad and Tobago | 0.7 /100 | #249 | Tragic 55.5% |
| Delaware | 0.7 /100 | #250 | Tragic 55.5% |
| Immigrants | Cambodia | 0.6 /100 | #251 | Tragic 55.4% |
| Aleuts | 0.6 /100 | #252 | Tragic 55.4% |
| Immigrants | Barbados | 0.6 /100 | #253 | Tragic 55.4% |
| Japanese | 0.5 /100 | #254 | Tragic 55.2% |
| Immigrants | Bahamas | 0.5 /100 | #255 | Tragic 55.2% |