Hmong vs Malaysian Associate's Degree
COMPARE
Hmong
Malaysian
Associate's Degree
Associate's Degree Comparison
Hmong
Malaysians
43.4%
ASSOCIATE'S DEGREE
3.2/ 100
METRIC RATING
228th/ 347
METRIC RANK
41.6%
ASSOCIATE'S DEGREE
0.4/ 100
METRIC RATING
259th/ 347
METRIC RANK
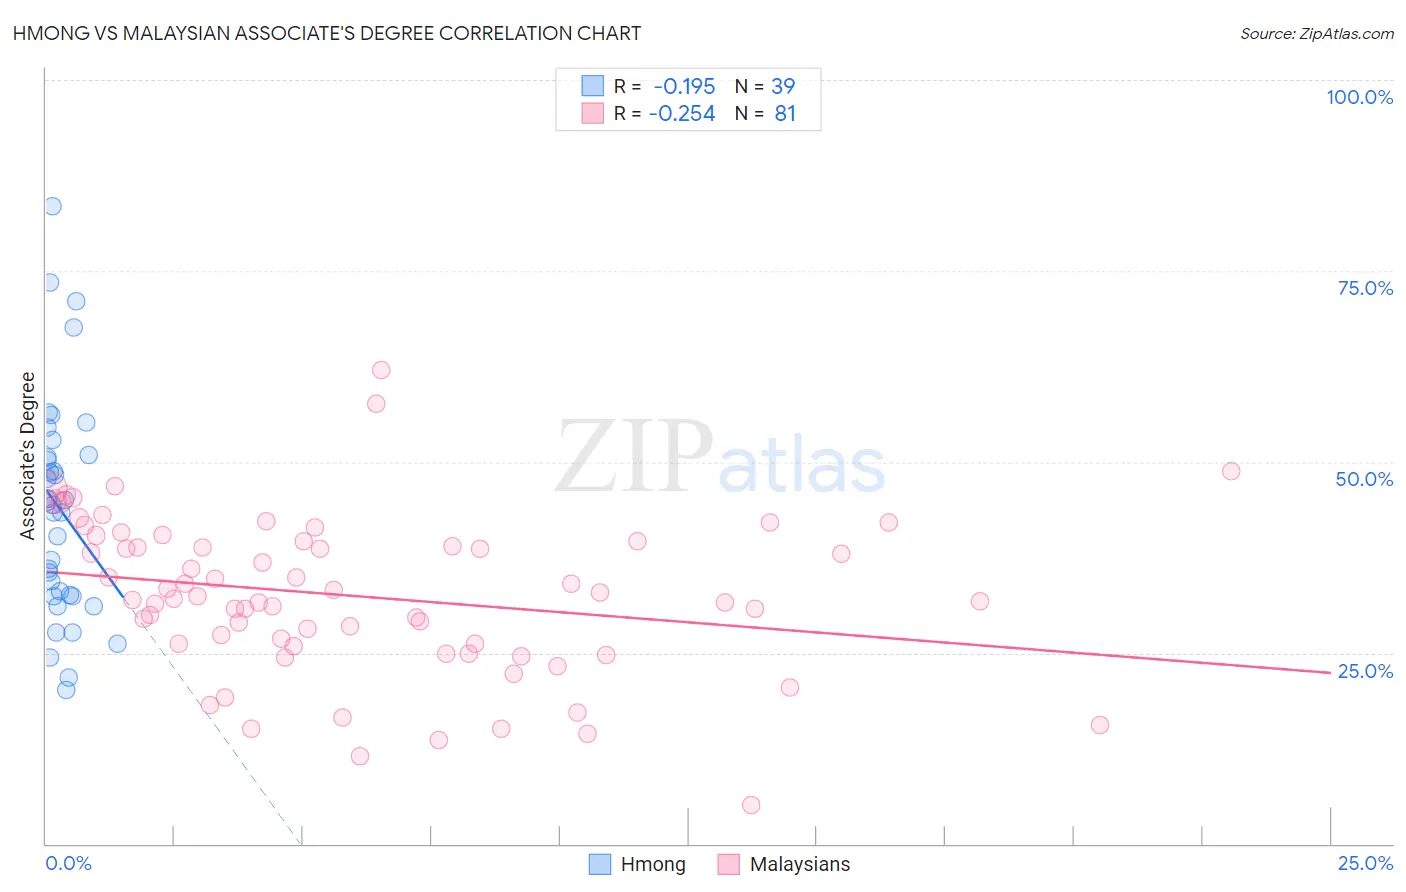
Hmong vs Malaysian Associate's Degree Correlation Chart
The statistical analysis conducted on geographies consisting of 24,680,511 people shows a poor negative correlation between the proportion of Hmong and percentage of population with at least associate's degree education in the United States with a correlation coefficient (R) of -0.195 and weighted average of 43.4%. Similarly, the statistical analysis conducted on geographies consisting of 226,101,912 people shows a weak negative correlation between the proportion of Malaysians and percentage of population with at least associate's degree education in the United States with a correlation coefficient (R) of -0.254 and weighted average of 41.6%, a difference of 4.3%.
Associate's Degree Correlation Summary
| Measurement | Hmong | Malaysian |
| Minimum | 20.2% | 5.0% |
| Maximum | 83.4% | 62.0% |
| Range | 63.2% | 57.0% |
| Mean | 43.7% | 32.4% |
| Median | 44.4% | 32.1% |
| Interquartile 25% (IQ1) | 32.4% | 26.1% |
| Interquartile 75% (IQ3) | 50.9% | 39.7% |
| Interquartile Range (IQR) | 18.6% | 13.6% |
| Standard Deviation (Sample) | 14.5% | 10.4% |
| Standard Deviation (Population) | 14.3% | 10.4% |
Similar Demographics by Associate's Degree
Demographics Similar to Hmong by Associate's Degree
In terms of associate's degree, the demographic groups most similar to Hmong are Immigrants from Trinidad and Tobago (43.3%, a difference of 0.16%), Immigrants from Barbados (43.3%, a difference of 0.23%), Liberian (43.3%, a difference of 0.23%), Trinidadian and Tobagonian (43.6%, a difference of 0.44%), and Immigrants from Burma/Myanmar (43.7%, a difference of 0.62%).
| Demographics | Rating | Rank | Associate's Degree |
| Immigrants | Western Africa | 6.6 /100 | #221 | Tragic 44.1% |
| Barbadians | 5.8 /100 | #222 | Tragic 43.9% |
| Sub-Saharan Africans | 5.5 /100 | #223 | Tragic 43.9% |
| West Indians | 5.2 /100 | #224 | Tragic 43.8% |
| Guamanians/Chamorros | 4.8 /100 | #225 | Tragic 43.8% |
| Immigrants | Burma/Myanmar | 4.3 /100 | #226 | Tragic 43.7% |
| Trinidadians and Tobagonians | 4.0 /100 | #227 | Tragic 43.6% |
| Hmong | 3.2 /100 | #228 | Tragic 43.4% |
| Immigrants | Trinidad and Tobago | 3.0 /100 | #229 | Tragic 43.3% |
| Immigrants | Barbados | 2.9 /100 | #230 | Tragic 43.3% |
| Liberians | 2.9 /100 | #231 | Tragic 43.3% |
| Native Hawaiians | 2.3 /100 | #232 | Tragic 43.1% |
| Tongans | 2.2 /100 | #233 | Tragic 43.0% |
| Tlingit-Haida | 2.1 /100 | #234 | Tragic 43.0% |
| Ecuadorians | 2.0 /100 | #235 | Tragic 43.0% |
Demographics Similar to Malaysians by Associate's Degree
In terms of associate's degree, the demographic groups most similar to Malaysians are Japanese (41.7%, a difference of 0.10%), Marshallese (41.6%, a difference of 0.19%), Spanish American (41.8%, a difference of 0.32%), Nicaraguan (41.5%, a difference of 0.32%), and Immigrants from Congo (41.8%, a difference of 0.38%).
| Demographics | Rating | Rank | Associate's Degree |
| French American Indians | 0.6 /100 | #252 | Tragic 42.0% |
| Indonesians | 0.6 /100 | #253 | Tragic 41.9% |
| Cubans | 0.6 /100 | #254 | Tragic 41.9% |
| Immigrants | Guyana | 0.5 /100 | #255 | Tragic 41.8% |
| Immigrants | Congo | 0.5 /100 | #256 | Tragic 41.8% |
| Spanish Americans | 0.5 /100 | #257 | Tragic 41.8% |
| Japanese | 0.5 /100 | #258 | Tragic 41.7% |
| Malaysians | 0.4 /100 | #259 | Tragic 41.6% |
| Marshallese | 0.4 /100 | #260 | Tragic 41.6% |
| Nicaraguans | 0.4 /100 | #261 | Tragic 41.5% |
| Bahamians | 0.4 /100 | #262 | Tragic 41.5% |
| Immigrants | Jamaica | 0.3 /100 | #263 | Tragic 41.5% |
| Osage | 0.3 /100 | #264 | Tragic 41.5% |
| Africans | 0.2 /100 | #265 | Tragic 41.1% |
| Samoans | 0.2 /100 | #266 | Tragic 41.1% |