Hmong vs Immigrants from Austria Professional Degree
COMPARE
Hmong
Immigrants from Austria
Professional Degree
Professional Degree Comparison
Hmong
Immigrants from Austria
3.7%
PROFESSIONAL DEGREE
1.6/ 100
METRIC RATING
248th/ 347
METRIC RANK
6.0%
PROFESSIONAL DEGREE
100.0/ 100
METRIC RATING
37th/ 347
METRIC RANK
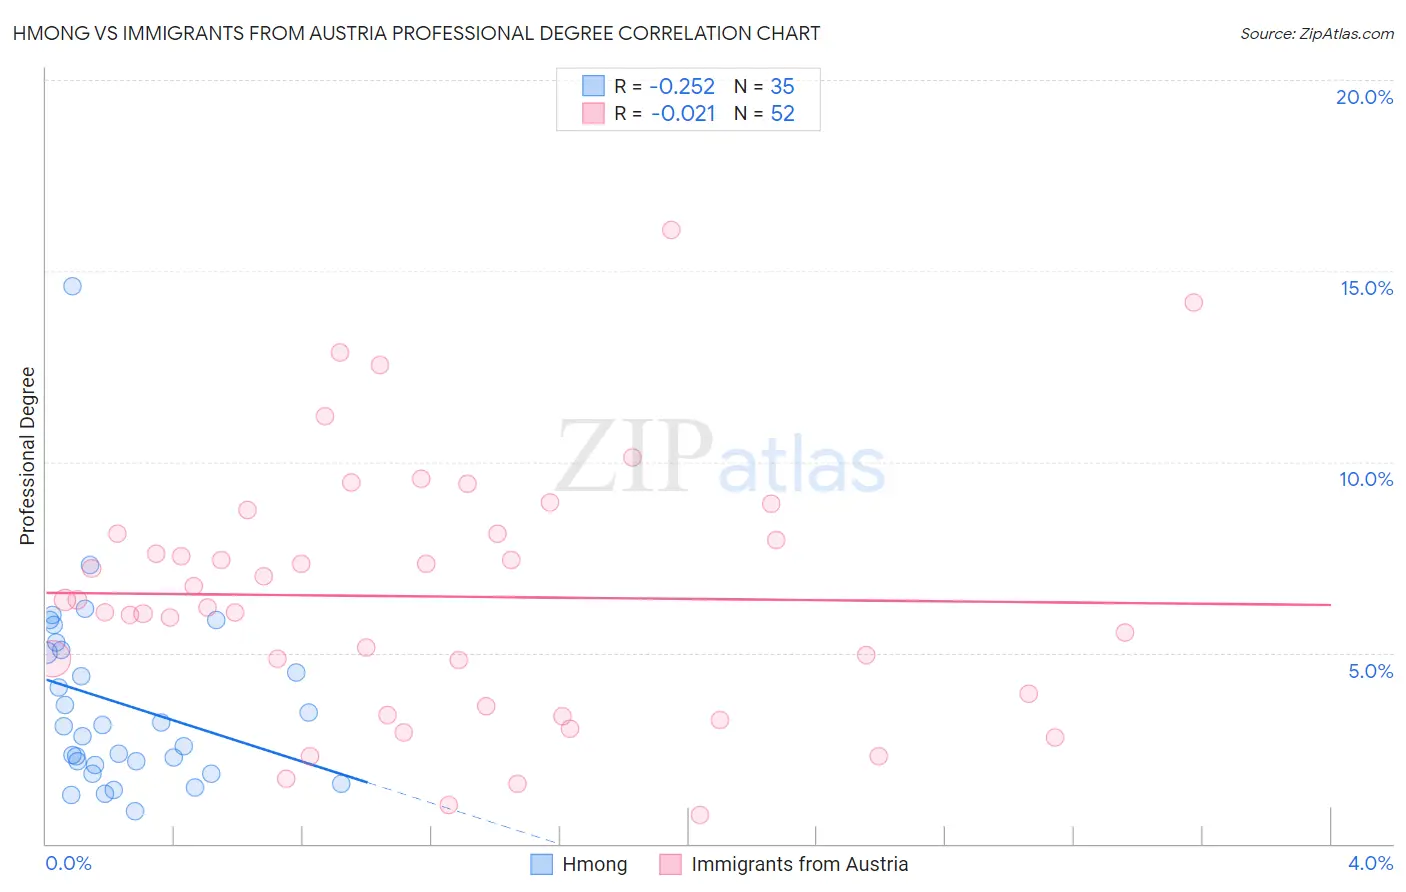
Hmong vs Immigrants from Austria Professional Degree Correlation Chart
The statistical analysis conducted on geographies consisting of 24,646,446 people shows a weak negative correlation between the proportion of Hmong and percentage of population with at least professional degree education in the United States with a correlation coefficient (R) of -0.252 and weighted average of 3.7%. Similarly, the statistical analysis conducted on geographies consisting of 167,912,662 people shows no correlation between the proportion of Immigrants from Austria and percentage of population with at least professional degree education in the United States with a correlation coefficient (R) of -0.021 and weighted average of 6.0%, a difference of 60.8%.
Professional Degree Correlation Summary
| Measurement | Hmong | Immigrants from Austria |
| Minimum | 0.86% | 0.74% |
| Maximum | 14.6% | 16.1% |
| Range | 13.7% | 15.3% |
| Mean | 3.7% | 6.5% |
| Median | 3.1% | 6.3% |
| Interquartile 25% (IQ1) | 2.0% | 3.8% |
| Interquartile 75% (IQ3) | 5.1% | 8.1% |
| Interquartile Range (IQR) | 3.0% | 4.4% |
| Standard Deviation (Sample) | 2.6% | 3.3% |
| Standard Deviation (Population) | 2.5% | 3.3% |
Similar Demographics by Professional Degree
Demographics Similar to Hmong by Professional Degree
In terms of professional degree, the demographic groups most similar to Hmong are Immigrants from Grenada (3.7%, a difference of 0.11%), Guyanese (3.8%, a difference of 0.16%), Marshallese (3.8%, a difference of 0.18%), Immigrants from Fiji (3.7%, a difference of 0.18%), and French American Indian (3.8%, a difference of 0.36%).
| Demographics | Rating | Rank | Professional Degree |
| Alaskan Athabascans | 2.3 /100 | #241 | Tragic 3.8% |
| Native Hawaiians | 2.3 /100 | #242 | Tragic 3.8% |
| Guamanians/Chamorros | 2.2 /100 | #243 | Tragic 3.8% |
| Immigrants | Bahamas | 2.0 /100 | #244 | Tragic 3.8% |
| French American Indians | 1.7 /100 | #245 | Tragic 3.8% |
| Marshallese | 1.7 /100 | #246 | Tragic 3.8% |
| Guyanese | 1.6 /100 | #247 | Tragic 3.8% |
| Hmong | 1.6 /100 | #248 | Tragic 3.7% |
| Immigrants | Grenada | 1.5 /100 | #249 | Tragic 3.7% |
| Immigrants | Fiji | 1.5 /100 | #250 | Tragic 3.7% |
| Immigrants | Nicaragua | 1.4 /100 | #251 | Tragic 3.7% |
| Jamaicans | 1.4 /100 | #252 | Tragic 3.7% |
| Pueblo | 1.4 /100 | #253 | Tragic 3.7% |
| Tongans | 1.3 /100 | #254 | Tragic 3.7% |
| Osage | 1.2 /100 | #255 | Tragic 3.7% |
Demographics Similar to Immigrants from Austria by Professional Degree
In terms of professional degree, the demographic groups most similar to Immigrants from Austria are Immigrants from Norway (6.0%, a difference of 0.20%), Immigrants from Russia (6.0%, a difference of 0.32%), Immigrants from South Africa (6.0%, a difference of 0.45%), Cambodian (6.0%, a difference of 0.92%), and New Zealander (6.0%, a difference of 1.1%).
| Demographics | Rating | Rank | Professional Degree |
| Immigrants | Turkey | 100.0 /100 | #30 | Exceptional 6.2% |
| Immigrants | India | 100.0 /100 | #31 | Exceptional 6.2% |
| Thais | 100.0 /100 | #32 | Exceptional 6.1% |
| Burmese | 100.0 /100 | #33 | Exceptional 6.1% |
| Mongolians | 100.0 /100 | #34 | Exceptional 6.1% |
| Immigrants | Korea | 100.0 /100 | #35 | Exceptional 6.1% |
| Immigrants | Russia | 100.0 /100 | #36 | Exceptional 6.0% |
| Immigrants | Austria | 100.0 /100 | #37 | Exceptional 6.0% |
| Immigrants | Norway | 100.0 /100 | #38 | Exceptional 6.0% |
| Immigrants | South Africa | 100.0 /100 | #39 | Exceptional 6.0% |
| Cambodians | 100.0 /100 | #40 | Exceptional 6.0% |
| New Zealanders | 100.0 /100 | #41 | Exceptional 6.0% |
| Estonians | 100.0 /100 | #42 | Exceptional 6.0% |
| Immigrants | Saudi Arabia | 100.0 /100 | #43 | Exceptional 5.9% |
| Argentineans | 100.0 /100 | #44 | Exceptional 5.9% |