Hmong vs Haitian 3rd Grade
COMPARE
Hmong
Haitian
3rd Grade
3rd Grade Comparison
Hmong
Haitians
97.9%
3RD GRADE
80.3/ 100
METRIC RATING
142nd/ 347
METRIC RANK
96.9%
3RD GRADE
0.0/ 100
METRIC RATING
297th/ 347
METRIC RANK
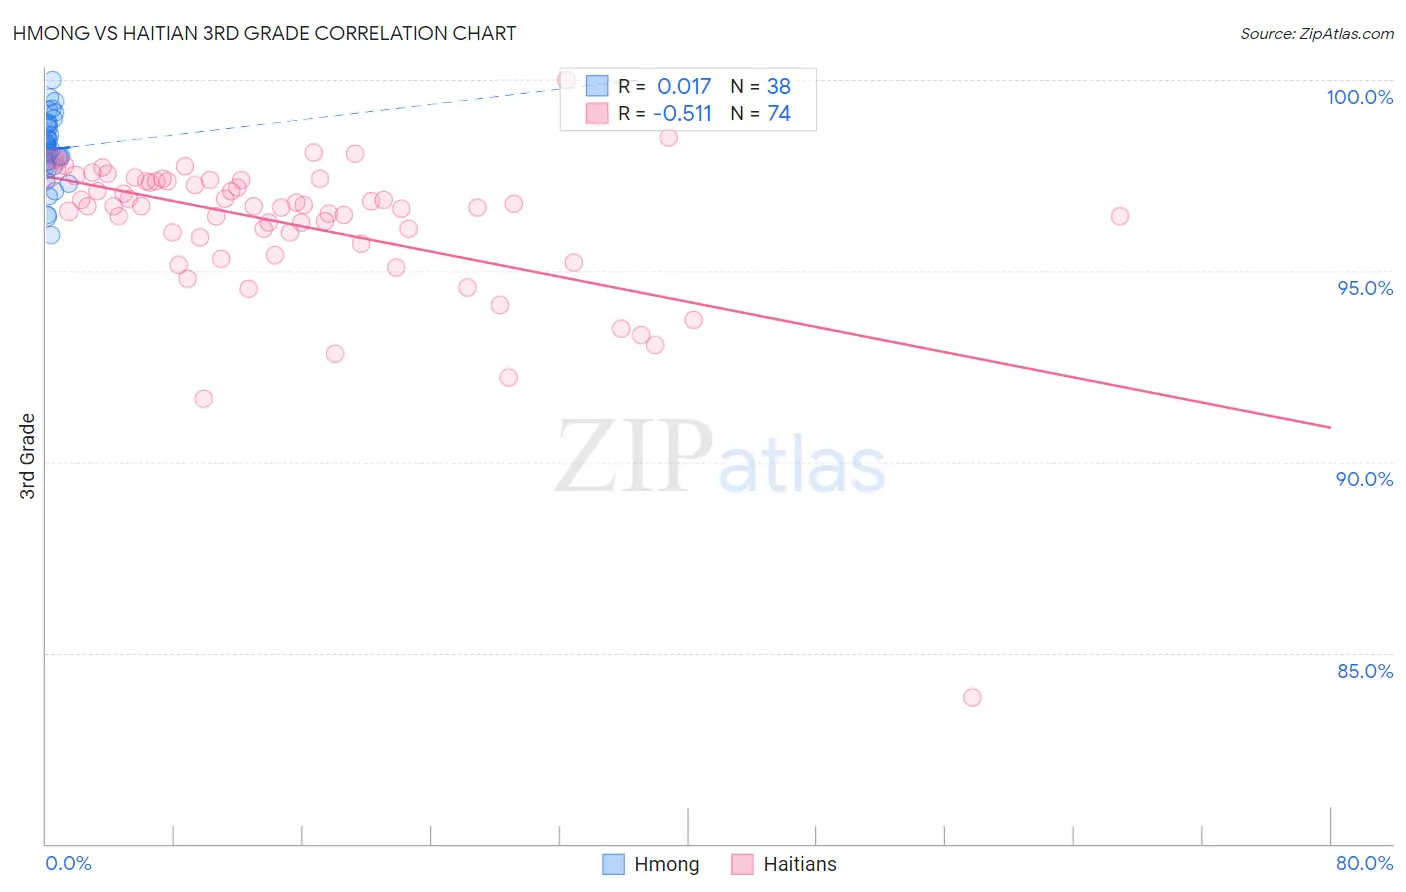
Hmong vs Haitian 3rd Grade Correlation Chart
The statistical analysis conducted on geographies consisting of 24,672,093 people shows no correlation between the proportion of Hmong and percentage of population with at least 3rd grade education in the United States with a correlation coefficient (R) of 0.017 and weighted average of 97.9%. Similarly, the statistical analysis conducted on geographies consisting of 288,018,742 people shows a substantial negative correlation between the proportion of Haitians and percentage of population with at least 3rd grade education in the United States with a correlation coefficient (R) of -0.511 and weighted average of 96.9%, a difference of 1.1%.
3rd Grade Correlation Summary
| Measurement | Hmong | Haitian |
| Minimum | 95.9% | 83.8% |
| Maximum | 100.0% | 100.0% |
| Range | 4.1% | 16.2% |
| Mean | 98.2% | 96.2% |
| Median | 98.2% | 96.7% |
| Interquartile 25% (IQ1) | 97.8% | 95.9% |
| Interquartile 75% (IQ3) | 98.8% | 97.4% |
| Interquartile Range (IQR) | 1.1% | 1.5% |
| Standard Deviation (Sample) | 0.88% | 2.1% |
| Standard Deviation (Population) | 0.87% | 2.1% |
Similar Demographics by 3rd Grade
Demographics Similar to Hmong by 3rd Grade
In terms of 3rd grade, the demographic groups most similar to Hmong are Filipino (97.9%, a difference of 0.0%), Burmese (97.9%, a difference of 0.0%), Immigrants from Greece (97.9%, a difference of 0.0%), Alsatian (97.9%, a difference of 0.010%), and Immigrants from Turkey (97.9%, a difference of 0.020%).
| Demographics | Rating | Rank | 3rd Grade |
| Cambodians | 88.1 /100 | #135 | Excellent 97.9% |
| Spaniards | 87.9 /100 | #136 | Excellent 97.9% |
| Immigrants | Romania | 87.9 /100 | #137 | Excellent 97.9% |
| Israelis | 86.6 /100 | #138 | Excellent 97.9% |
| Blackfeet | 86.3 /100 | #139 | Excellent 97.9% |
| Palestinians | 84.6 /100 | #140 | Excellent 97.9% |
| Immigrants | Turkey | 83.5 /100 | #141 | Excellent 97.9% |
| Hmong | 80.3 /100 | #142 | Excellent 97.9% |
| Filipinos | 79.9 /100 | #143 | Good 97.9% |
| Burmese | 79.6 /100 | #144 | Good 97.9% |
| Immigrants | Greece | 79.5 /100 | #145 | Good 97.9% |
| Alsatians | 78.3 /100 | #146 | Good 97.9% |
| Immigrants | Israel | 77.3 /100 | #147 | Good 97.9% |
| Immigrants | Moldova | 77.1 /100 | #148 | Good 97.9% |
| Immigrants | North Macedonia | 74.5 /100 | #149 | Good 97.8% |
Demographics Similar to Haitians by 3rd Grade
In terms of 3rd grade, the demographic groups most similar to Haitians are Immigrants from Dominica (96.9%, a difference of 0.0%), Immigrants (96.9%, a difference of 0.020%), Somali (96.8%, a difference of 0.020%), Immigrants from South Eastern Asia (96.8%, a difference of 0.020%), and Immigrants from Cuba (96.8%, a difference of 0.030%).
| Demographics | Rating | Rank | 3rd Grade |
| Immigrants | Portugal | 0.0 /100 | #290 | Tragic 97.0% |
| Immigrants | Afghanistan | 0.0 /100 | #291 | Tragic 97.0% |
| British West Indians | 0.0 /100 | #292 | Tragic 97.0% |
| Immigrants | Grenada | 0.0 /100 | #293 | Tragic 97.0% |
| Malaysians | 0.0 /100 | #294 | Tragic 97.0% |
| Immigrants | Eritrea | 0.0 /100 | #295 | Tragic 97.0% |
| Immigrants | Immigrants | 0.0 /100 | #296 | Tragic 96.9% |
| Haitians | 0.0 /100 | #297 | Tragic 96.9% |
| Immigrants | Dominica | 0.0 /100 | #298 | Tragic 96.9% |
| Somalis | 0.0 /100 | #299 | Tragic 96.8% |
| Immigrants | South Eastern Asia | 0.0 /100 | #300 | Tragic 96.8% |
| Immigrants | Cuba | 0.0 /100 | #301 | Tragic 96.8% |
| Immigrants | Somalia | 0.0 /100 | #302 | Tragic 96.8% |
| Ecuadorians | 0.0 /100 | #303 | Tragic 96.7% |
| Immigrants | Caribbean | 0.0 /100 | #304 | Tragic 96.7% |