Hmong vs Central American Indian 10th Grade
COMPARE
Hmong
Central American Indian
10th Grade
10th Grade Comparison
Hmong
Central American Indians
94.1%
10TH GRADE
86.6/ 100
METRIC RATING
141st/ 347
METRIC RANK
89.7%
10TH GRADE
0.0/ 100
METRIC RATING
326th/ 347
METRIC RANK
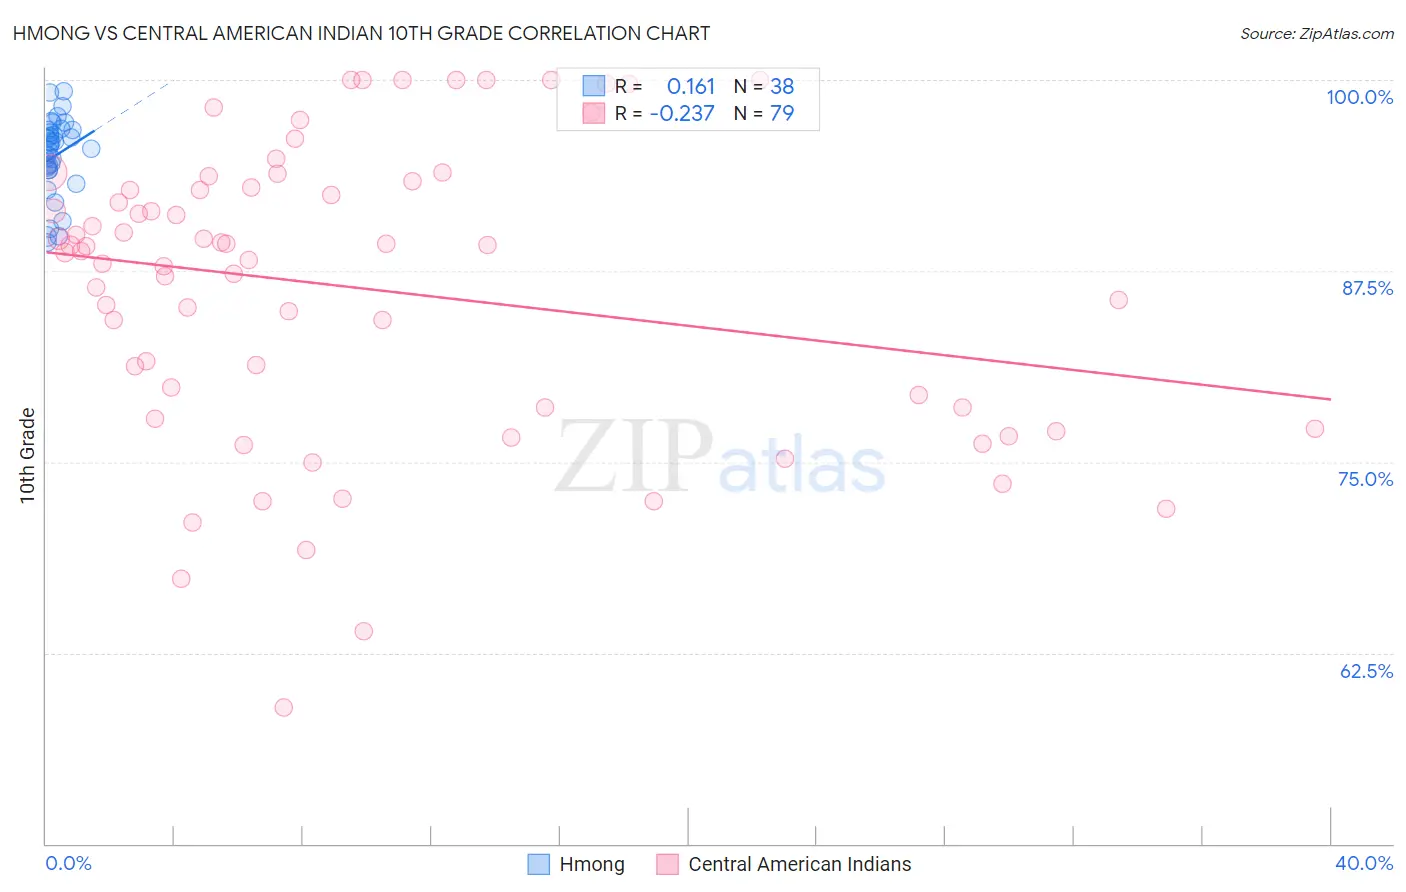
Hmong vs Central American Indian 10th Grade Correlation Chart
The statistical analysis conducted on geographies consisting of 24,672,093 people shows a poor positive correlation between the proportion of Hmong and percentage of population with at least 10th grade education in the United States with a correlation coefficient (R) of 0.161 and weighted average of 94.1%. Similarly, the statistical analysis conducted on geographies consisting of 326,142,643 people shows a weak negative correlation between the proportion of Central American Indians and percentage of population with at least 10th grade education in the United States with a correlation coefficient (R) of -0.237 and weighted average of 89.7%, a difference of 4.9%.
10th Grade Correlation Summary
| Measurement | Hmong | Central American Indian |
| Minimum | 89.3% | 58.9% |
| Maximum | 99.2% | 100.0% |
| Range | 9.9% | 41.1% |
| Mean | 95.0% | 86.3% |
| Median | 95.6% | 88.8% |
| Interquartile 25% (IQ1) | 94.1% | 78.5% |
| Interquartile 75% (IQ3) | 96.7% | 93.0% |
| Interquartile Range (IQR) | 2.6% | 14.4% |
| Standard Deviation (Sample) | 2.5% | 9.6% |
| Standard Deviation (Population) | 2.5% | 9.6% |
Similar Demographics by 10th Grade
Demographics Similar to Hmong by 10th Grade
In terms of 10th grade, the demographic groups most similar to Hmong are Albanian (94.1%, a difference of 0.0%), Immigrants from Jordan (94.1%, a difference of 0.020%), Cherokee (94.1%, a difference of 0.030%), Immigrants from Kazakhstan (94.1%, a difference of 0.030%), and Nonimmigrants (94.1%, a difference of 0.050%).
| Demographics | Rating | Rank | 10th Grade |
| Osage | 91.7 /100 | #134 | Exceptional 94.2% |
| Immigrants | Korea | 91.3 /100 | #135 | Exceptional 94.2% |
| Shoshone | 90.8 /100 | #136 | Exceptional 94.2% |
| Arapaho | 90.5 /100 | #137 | Exceptional 94.2% |
| Immigrants | Sri Lanka | 89.9 /100 | #138 | Excellent 94.2% |
| Immigrants | Bosnia and Herzegovina | 89.4 /100 | #139 | Excellent 94.2% |
| Immigrants | Jordan | 87.6 /100 | #140 | Excellent 94.1% |
| Hmong | 86.6 /100 | #141 | Excellent 94.1% |
| Albanians | 86.5 /100 | #142 | Excellent 94.1% |
| Cherokee | 84.9 /100 | #143 | Excellent 94.1% |
| Immigrants | Kazakhstan | 84.9 /100 | #144 | Excellent 94.1% |
| Immigrants | Nonimmigrants | 83.8 /100 | #145 | Excellent 94.1% |
| Chickasaw | 82.6 /100 | #146 | Excellent 94.1% |
| Immigrants | Ukraine | 81.5 /100 | #147 | Excellent 94.0% |
| Arabs | 80.9 /100 | #148 | Excellent 94.0% |
Demographics Similar to Central American Indians by 10th Grade
In terms of 10th grade, the demographic groups most similar to Central American Indians are Puerto Rican (89.8%, a difference of 0.18%), Immigrants from Armenia (89.9%, a difference of 0.20%), Immigrants from Nicaragua (89.5%, a difference of 0.26%), Immigrants from Cabo Verde (89.5%, a difference of 0.27%), and Dominican (89.4%, a difference of 0.37%).
| Demographics | Rating | Rank | 10th Grade |
| Nicaraguans | 0.0 /100 | #319 | Tragic 90.2% |
| Houma | 0.0 /100 | #320 | Tragic 90.2% |
| Belizeans | 0.0 /100 | #321 | Tragic 90.2% |
| Tohono O'odham | 0.0 /100 | #322 | Tragic 90.1% |
| Immigrants | Belize | 0.0 /100 | #323 | Tragic 90.1% |
| Immigrants | Armenia | 0.0 /100 | #324 | Tragic 89.9% |
| Puerto Ricans | 0.0 /100 | #325 | Tragic 89.8% |
| Central American Indians | 0.0 /100 | #326 | Tragic 89.7% |
| Immigrants | Nicaragua | 0.0 /100 | #327 | Tragic 89.5% |
| Immigrants | Cabo Verde | 0.0 /100 | #328 | Tragic 89.5% |
| Dominicans | 0.0 /100 | #329 | Tragic 89.4% |
| Immigrants | Yemen | 0.0 /100 | #330 | Tragic 89.1% |
| Mexican American Indians | 0.0 /100 | #331 | Tragic 89.0% |
| Immigrants | Azores | 0.0 /100 | #332 | Tragic 89.0% |
| Hondurans | 0.0 /100 | #333 | Tragic 89.0% |