Hawaiian vs Immigrants from Singapore High School Diploma
COMPARE
Hawaiian
Immigrants from Singapore
High School Diploma
High School Diploma Comparison
Hawaiians
Immigrants from Singapore
88.6%
HIGH SCHOOL DIPLOMA
18.3/ 100
METRIC RATING
200th/ 347
METRIC RANK
91.7%
HIGH SCHOOL DIPLOMA
99.9/ 100
METRIC RATING
17th/ 347
METRIC RANK
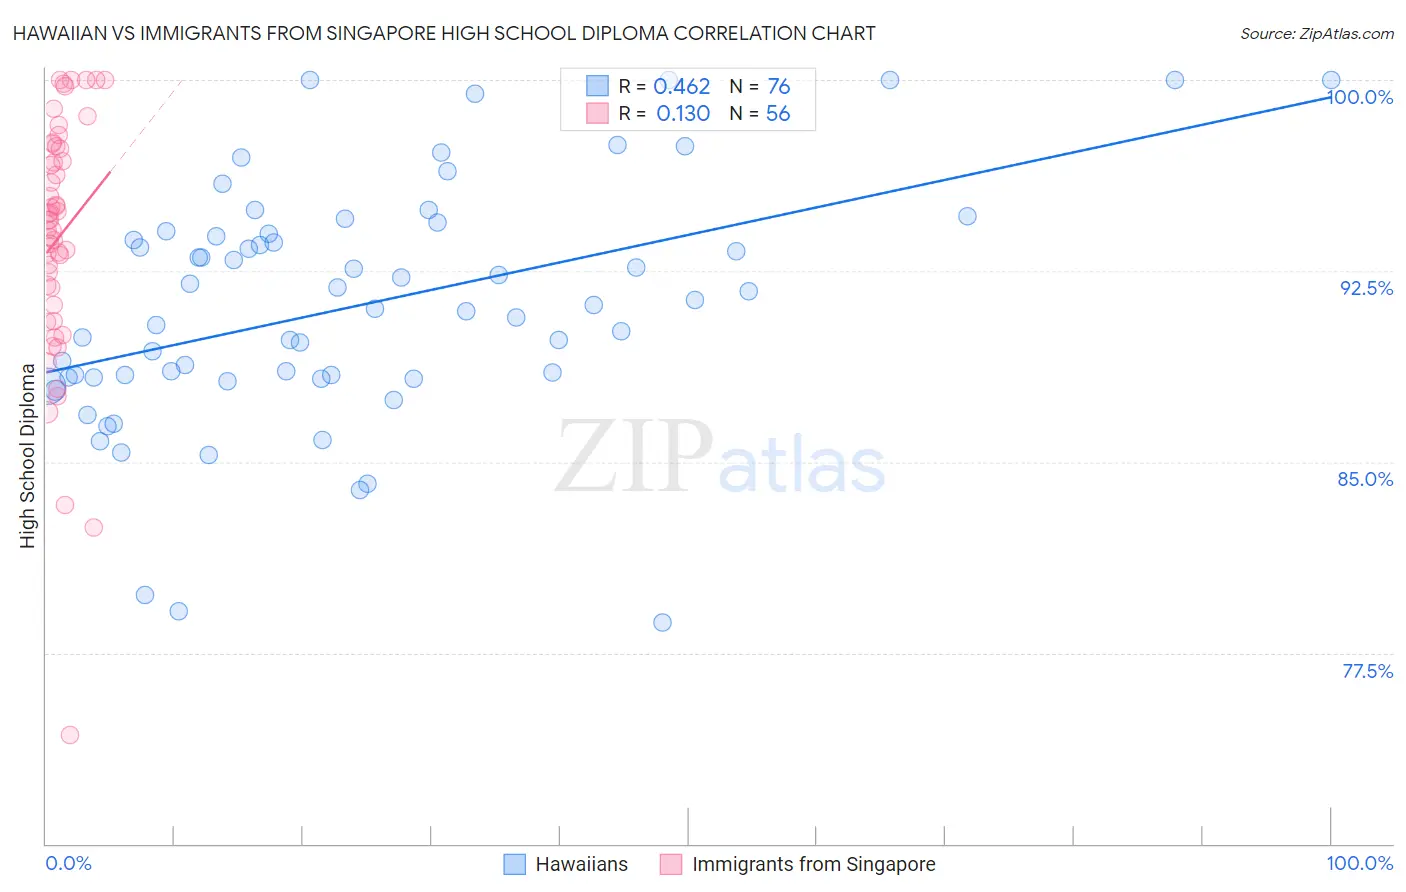
Hawaiian vs Immigrants from Singapore High School Diploma Correlation Chart
The statistical analysis conducted on geographies consisting of 327,620,955 people shows a moderate positive correlation between the proportion of Hawaiians and percentage of population with at least high school diploma education in the United States with a correlation coefficient (R) of 0.462 and weighted average of 88.6%. Similarly, the statistical analysis conducted on geographies consisting of 137,521,094 people shows a poor positive correlation between the proportion of Immigrants from Singapore and percentage of population with at least high school diploma education in the United States with a correlation coefficient (R) of 0.130 and weighted average of 91.7%, a difference of 3.4%.
High School Diploma Correlation Summary
| Measurement | Hawaiian | Immigrants from Singapore |
| Minimum | 78.7% | 74.3% |
| Maximum | 100.0% | 100.0% |
| Range | 21.3% | 25.7% |
| Mean | 91.1% | 93.8% |
| Median | 91.1% | 94.5% |
| Interquartile 25% (IQ1) | 88.3% | 91.5% |
| Interquartile 75% (IQ3) | 93.9% | 97.3% |
| Interquartile Range (IQR) | 5.6% | 5.8% |
| Standard Deviation (Sample) | 4.7% | 4.9% |
| Standard Deviation (Population) | 4.7% | 4.9% |
Similar Demographics by High School Diploma
Demographics Similar to Hawaiians by High School Diploma
In terms of high school diploma, the demographic groups most similar to Hawaiians are Korean (88.6%, a difference of 0.0%), Liberian (88.7%, a difference of 0.010%), Marshallese (88.6%, a difference of 0.010%), Panamanian (88.6%, a difference of 0.010%), and Somali (88.6%, a difference of 0.020%).
| Demographics | Rating | Rank | High School Diploma |
| Immigrants | Oceania | 26.9 /100 | #193 | Fair 88.8% |
| Immigrants | Venezuela | 25.8 /100 | #194 | Fair 88.8% |
| Afghans | 23.9 /100 | #195 | Fair 88.8% |
| Immigrants | Southern Europe | 23.4 /100 | #196 | Fair 88.7% |
| French American Indians | 21.5 /100 | #197 | Fair 88.7% |
| Liberians | 18.8 /100 | #198 | Poor 88.7% |
| Marshallese | 18.7 /100 | #199 | Poor 88.6% |
| Hawaiians | 18.3 /100 | #200 | Poor 88.6% |
| Koreans | 18.1 /100 | #201 | Poor 88.6% |
| Panamanians | 18.0 /100 | #202 | Poor 88.6% |
| Somalis | 17.5 /100 | #203 | Poor 88.6% |
| Armenians | 17.2 /100 | #204 | Poor 88.6% |
| Immigrants | Micronesia | 16.4 /100 | #205 | Poor 88.6% |
| Arapaho | 16.1 /100 | #206 | Poor 88.6% |
| Immigrants | Sierra Leone | 15.8 /100 | #207 | Poor 88.6% |
Demographics Similar to Immigrants from Singapore by High School Diploma
In terms of high school diploma, the demographic groups most similar to Immigrants from Singapore are German (91.7%, a difference of 0.010%), Finnish (91.7%, a difference of 0.040%), Luxembourger (91.7%, a difference of 0.060%), Maltese (91.6%, a difference of 0.080%), and Bulgarian (91.8%, a difference of 0.090%).
| Demographics | Rating | Rank | High School Diploma |
| Croatians | 100.0 /100 | #10 | Exceptional 92.0% |
| Eastern Europeans | 100.0 /100 | #11 | Exceptional 91.9% |
| Poles | 100.0 /100 | #12 | Exceptional 91.9% |
| Danes | 100.0 /100 | #13 | Exceptional 91.8% |
| Bulgarians | 100.0 /100 | #14 | Exceptional 91.8% |
| Luxembourgers | 100.0 /100 | #15 | Exceptional 91.7% |
| Finns | 100.0 /100 | #16 | Exceptional 91.7% |
| Immigrants | Singapore | 99.9 /100 | #17 | Exceptional 91.7% |
| Germans | 99.9 /100 | #18 | Exceptional 91.7% |
| Maltese | 99.9 /100 | #19 | Exceptional 91.6% |
| Czechs | 99.9 /100 | #20 | Exceptional 91.6% |
| Filipinos | 99.9 /100 | #21 | Exceptional 91.6% |
| Estonians | 99.9 /100 | #22 | Exceptional 91.6% |
| Scandinavians | 99.9 /100 | #23 | Exceptional 91.5% |
| Italians | 99.9 /100 | #24 | Exceptional 91.5% |