Guyanese vs Immigrants from Panama Associate's Degree
COMPARE
Guyanese
Immigrants from Panama
Associate's Degree
Associate's Degree Comparison
Guyanese
Immigrants from Panama
42.3%
ASSOCIATE'S DEGREE
1.0/ 100
METRIC RATING
243rd/ 347
METRIC RANK
44.7%
ASSOCIATE'S DEGREE
12.4/ 100
METRIC RATING
215th/ 347
METRIC RANK
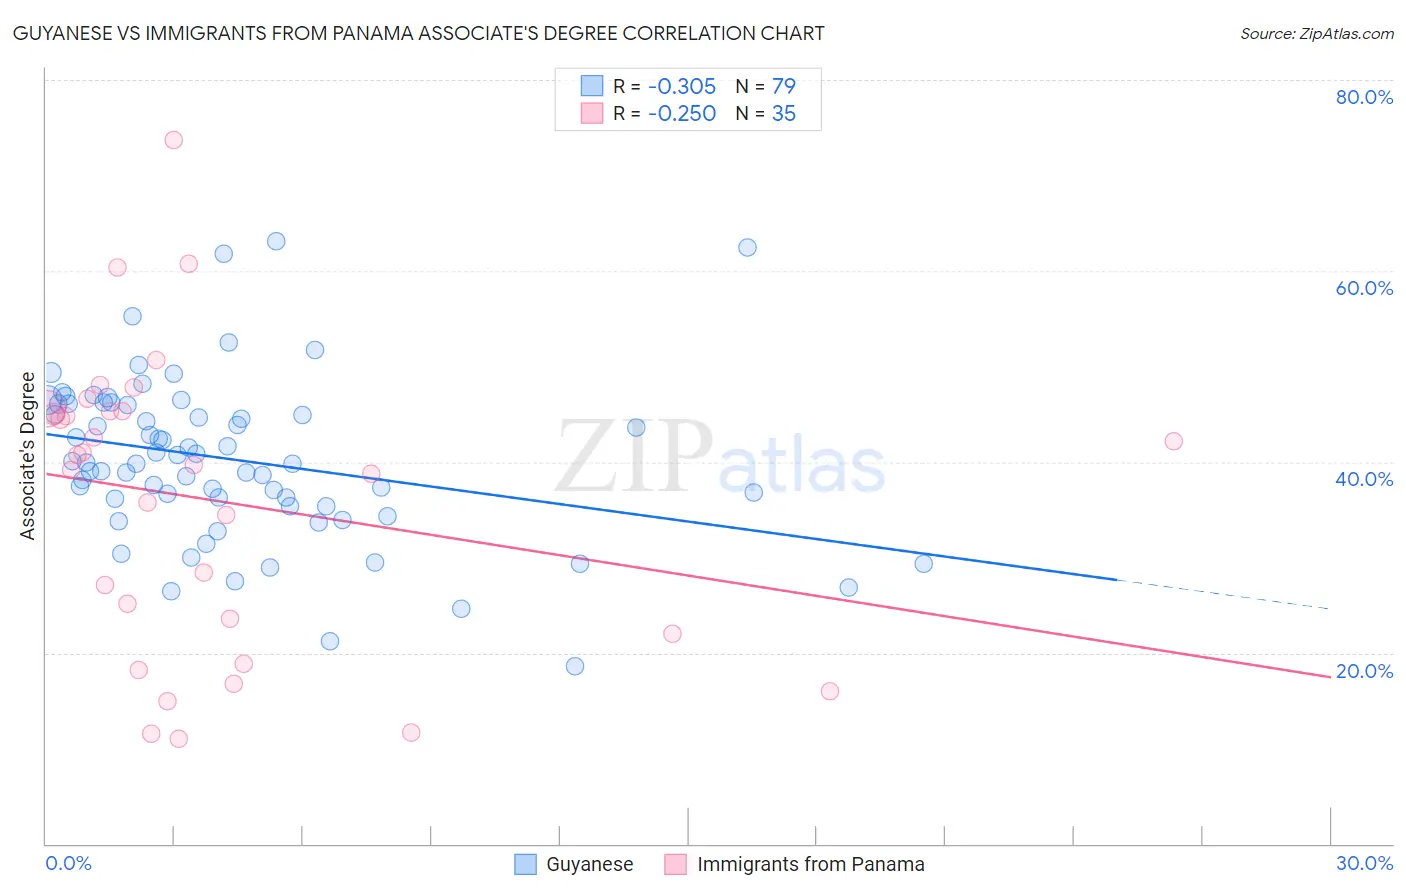
Guyanese vs Immigrants from Panama Associate's Degree Correlation Chart
The statistical analysis conducted on geographies consisting of 176,923,835 people shows a mild negative correlation between the proportion of Guyanese and percentage of population with at least associate's degree education in the United States with a correlation coefficient (R) of -0.305 and weighted average of 42.3%. Similarly, the statistical analysis conducted on geographies consisting of 221,180,588 people shows a weak negative correlation between the proportion of Immigrants from Panama and percentage of population with at least associate's degree education in the United States with a correlation coefficient (R) of -0.250 and weighted average of 44.7%, a difference of 5.5%.
Associate's Degree Correlation Summary
| Measurement | Guyanese | Immigrants from Panama |
| Minimum | 18.6% | 11.1% |
| Maximum | 63.1% | 73.8% |
| Range | 44.5% | 62.7% |
| Mean | 40.2% | 35.9% |
| Median | 39.9% | 39.6% |
| Interquartile 25% (IQ1) | 35.4% | 22.0% |
| Interquartile 75% (IQ3) | 46.0% | 45.4% |
| Interquartile Range (IQR) | 10.6% | 23.4% |
| Standard Deviation (Sample) | 8.5% | 15.5% |
| Standard Deviation (Population) | 8.5% | 15.3% |
Similar Demographics by Associate's Degree
Demographics Similar to Guyanese by Associate's Degree
In terms of associate's degree, the demographic groups most similar to Guyanese are Immigrants from West Indies (42.4%, a difference of 0.11%), British West Indian (42.4%, a difference of 0.12%), Immigrants from Liberia (42.3%, a difference of 0.14%), Immigrants from Cambodia (42.3%, a difference of 0.16%), and Delaware (42.3%, a difference of 0.19%).
| Demographics | Rating | Rank | Associate's Degree |
| Immigrants | St. Vincent and the Grenadines | 1.9 /100 | #236 | Tragic 42.9% |
| Immigrants | Nonimmigrants | 1.9 /100 | #237 | Tragic 42.9% |
| Iroquois | 1.7 /100 | #238 | Tragic 42.8% |
| Immigrants | Grenada | 1.3 /100 | #239 | Tragic 42.6% |
| Cree | 1.2 /100 | #240 | Tragic 42.5% |
| British West Indians | 1.0 /100 | #241 | Tragic 42.4% |
| Immigrants | West Indies | 1.0 /100 | #242 | Tragic 42.4% |
| Guyanese | 1.0 /100 | #243 | Tragic 42.3% |
| Immigrants | Liberia | 0.9 /100 | #244 | Tragic 42.3% |
| Immigrants | Cambodia | 0.9 /100 | #245 | Tragic 42.3% |
| Delaware | 0.9 /100 | #246 | Tragic 42.3% |
| Immigrants | Fiji | 0.8 /100 | #247 | Tragic 42.2% |
| Immigrants | Ecuador | 0.8 /100 | #248 | Tragic 42.2% |
| Jamaicans | 0.7 /100 | #249 | Tragic 42.1% |
| U.S. Virgin Islanders | 0.7 /100 | #250 | Tragic 42.1% |
Demographics Similar to Immigrants from Panama by Associate's Degree
In terms of associate's degree, the demographic groups most similar to Immigrants from Panama are Immigrants from Middle Africa (44.7%, a difference of 0.060%), Immigrants from Nigeria (44.6%, a difference of 0.18%), Immigrants from Ghana (44.8%, a difference of 0.31%), Immigrants (44.5%, a difference of 0.37%), and French Canadian (44.9%, a difference of 0.43%).
| Demographics | Rating | Rank | Associate's Degree |
| Dutch | 17.6 /100 | #208 | Poor 45.0% |
| Immigrants | Costa Rica | 16.7 /100 | #209 | Poor 45.0% |
| Immigrants | Philippines | 16.7 /100 | #210 | Poor 45.0% |
| Immigrants | Zaire | 16.6 /100 | #211 | Poor 45.0% |
| French Canadians | 15.0 /100 | #212 | Poor 44.9% |
| Immigrants | Ghana | 14.2 /100 | #213 | Poor 44.8% |
| Immigrants | Middle Africa | 12.7 /100 | #214 | Poor 44.7% |
| Immigrants | Panama | 12.4 /100 | #215 | Poor 44.7% |
| Immigrants | Nigeria | 11.4 /100 | #216 | Poor 44.6% |
| Immigrants | Immigrants | 10.5 /100 | #217 | Poor 44.5% |
| Spanish | 9.4 /100 | #218 | Tragic 44.4% |
| Whites/Caucasians | 7.5 /100 | #219 | Tragic 44.2% |
| Portuguese | 7.2 /100 | #220 | Tragic 44.1% |
| Immigrants | Western Africa | 6.6 /100 | #221 | Tragic 44.1% |
| Barbadians | 5.8 /100 | #222 | Tragic 43.9% |