Guatemalan vs Venezuelan Associate's Degree
COMPARE
Guatemalan
Venezuelan
Associate's Degree
Associate's Degree Comparison
Guatemalans
Venezuelans
38.5%
ASSOCIATE'S DEGREE
0.0/ 100
METRIC RATING
303rd/ 347
METRIC RANK
49.4%
ASSOCIATE'S DEGREE
97.0/ 100
METRIC RATING
104th/ 347
METRIC RANK
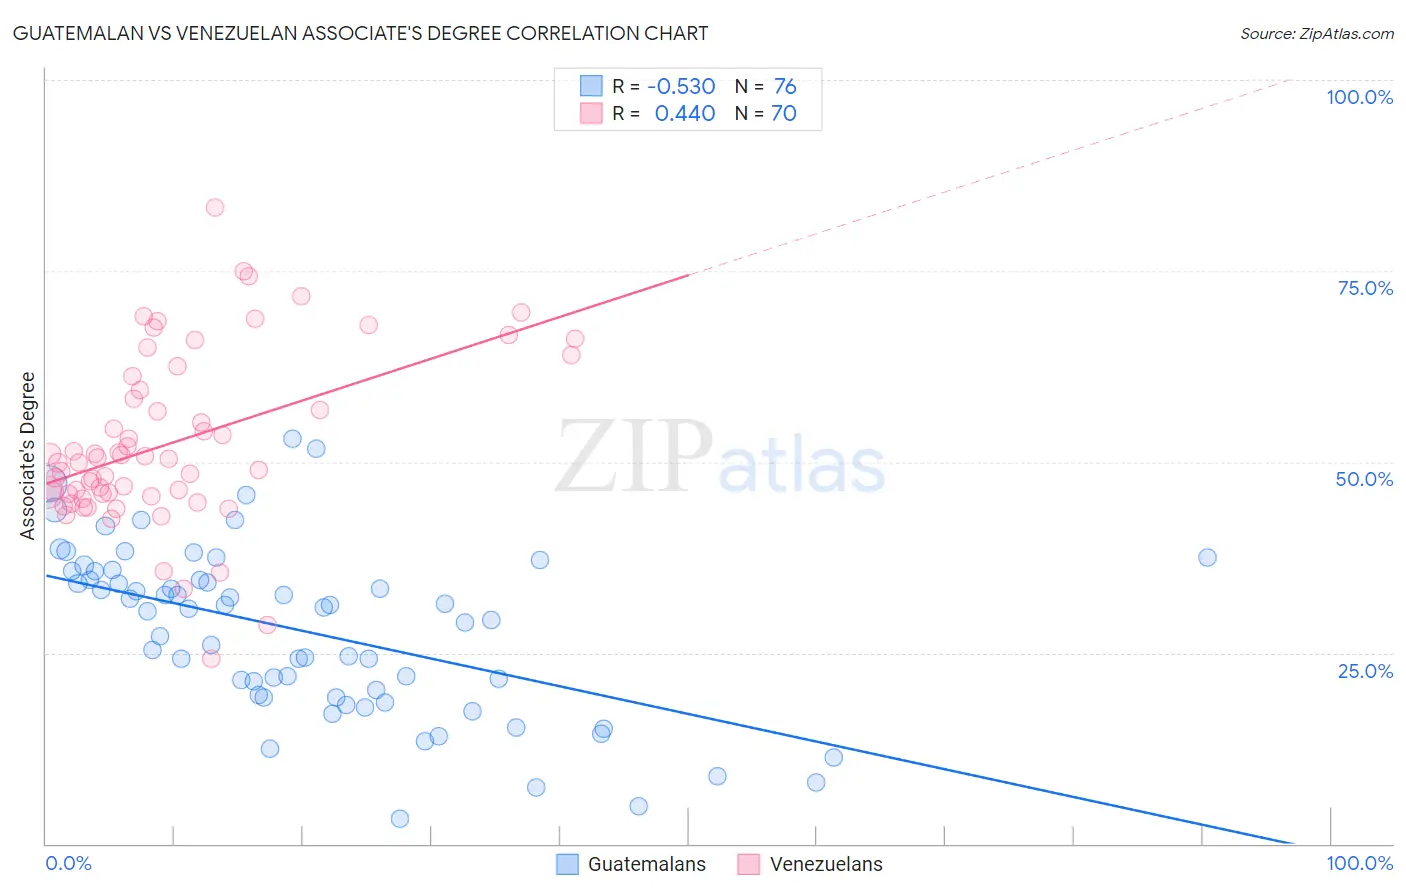
Guatemalan vs Venezuelan Associate's Degree Correlation Chart
The statistical analysis conducted on geographies consisting of 409,533,584 people shows a substantial negative correlation between the proportion of Guatemalans and percentage of population with at least associate's degree education in the United States with a correlation coefficient (R) of -0.530 and weighted average of 38.5%. Similarly, the statistical analysis conducted on geographies consisting of 306,307,372 people shows a moderate positive correlation between the proportion of Venezuelans and percentage of population with at least associate's degree education in the United States with a correlation coefficient (R) of 0.440 and weighted average of 49.4%, a difference of 28.2%.
Associate's Degree Correlation Summary
| Measurement | Guatemalan | Venezuelan |
| Minimum | 3.3% | 24.3% |
| Maximum | 53.1% | 83.4% |
| Range | 49.8% | 59.1% |
| Mean | 27.8% | 52.4% |
| Median | 30.6% | 50.1% |
| Interquartile 25% (IQ1) | 19.3% | 45.8% |
| Interquartile 75% (IQ3) | 35.1% | 59.4% |
| Interquartile Range (IQR) | 15.8% | 13.7% |
| Standard Deviation (Sample) | 11.0% | 11.2% |
| Standard Deviation (Population) | 10.9% | 11.1% |
Similar Demographics by Associate's Degree
Demographics Similar to Guatemalans by Associate's Degree
In terms of associate's degree, the demographic groups most similar to Guatemalans are Sioux (38.5%, a difference of 0.050%), Colville (38.5%, a difference of 0.090%), Immigrants from Honduras (38.5%, a difference of 0.12%), Shoshone (38.4%, a difference of 0.19%), and Immigrants from El Salvador (38.4%, a difference of 0.23%).
| Demographics | Rating | Rank | Associate's Degree |
| Cherokee | 0.0 /100 | #296 | Tragic 38.9% |
| Cape Verdeans | 0.0 /100 | #297 | Tragic 38.8% |
| Cheyenne | 0.0 /100 | #298 | Tragic 38.7% |
| Ute | 0.0 /100 | #299 | Tragic 38.6% |
| Chickasaw | 0.0 /100 | #300 | Tragic 38.6% |
| Tsimshian | 0.0 /100 | #301 | Tragic 38.6% |
| Colville | 0.0 /100 | #302 | Tragic 38.5% |
| Guatemalans | 0.0 /100 | #303 | Tragic 38.5% |
| Sioux | 0.0 /100 | #304 | Tragic 38.5% |
| Immigrants | Honduras | 0.0 /100 | #305 | Tragic 38.5% |
| Shoshone | 0.0 /100 | #306 | Tragic 38.4% |
| Immigrants | El Salvador | 0.0 /100 | #307 | Tragic 38.4% |
| Mexican American Indians | 0.0 /100 | #308 | Tragic 38.2% |
| Immigrants | Guatemala | 0.0 /100 | #309 | Tragic 38.1% |
| Immigrants | Dominican Republic | 0.0 /100 | #310 | Tragic 37.9% |
Demographics Similar to Venezuelans by Associate's Degree
In terms of associate's degree, the demographic groups most similar to Venezuelans are Ukrainian (49.4%, a difference of 0.060%), Croatian (49.3%, a difference of 0.15%), Immigrants from Italy (49.3%, a difference of 0.15%), Chilean (49.4%, a difference of 0.17%), and Syrian (49.3%, a difference of 0.18%).
| Demographics | Rating | Rank | Associate's Degree |
| Immigrants | Ukraine | 98.0 /100 | #97 | Exceptional 49.7% |
| Immigrants | Northern Africa | 97.9 /100 | #98 | Exceptional 49.7% |
| Macedonians | 97.8 /100 | #99 | Exceptional 49.6% |
| Immigrants | Nepal | 97.5 /100 | #100 | Exceptional 49.5% |
| Northern Europeans | 97.3 /100 | #101 | Exceptional 49.5% |
| Chileans | 97.3 /100 | #102 | Exceptional 49.4% |
| Ukrainians | 97.1 /100 | #103 | Exceptional 49.4% |
| Venezuelans | 97.0 /100 | #104 | Exceptional 49.4% |
| Croatians | 96.8 /100 | #105 | Exceptional 49.3% |
| Immigrants | Italy | 96.7 /100 | #106 | Exceptional 49.3% |
| Syrians | 96.7 /100 | #107 | Exceptional 49.3% |
| Jordanians | 96.6 /100 | #108 | Exceptional 49.2% |
| Immigrants | Morocco | 96.3 /100 | #109 | Exceptional 49.2% |
| Austrians | 95.8 /100 | #110 | Exceptional 49.1% |
| Immigrants | Venezuela | 95.8 /100 | #111 | Exceptional 49.1% |