Guatemalan vs South African Professional Degree
COMPARE
Guatemalan
South African
Professional Degree
Professional Degree Comparison
Guatemalans
South Africans
3.5%
PROFESSIONAL DEGREE
0.3/ 100
METRIC RATING
289th/ 347
METRIC RANK
5.7%
PROFESSIONAL DEGREE
100.0/ 100
METRIC RATING
57th/ 347
METRIC RANK
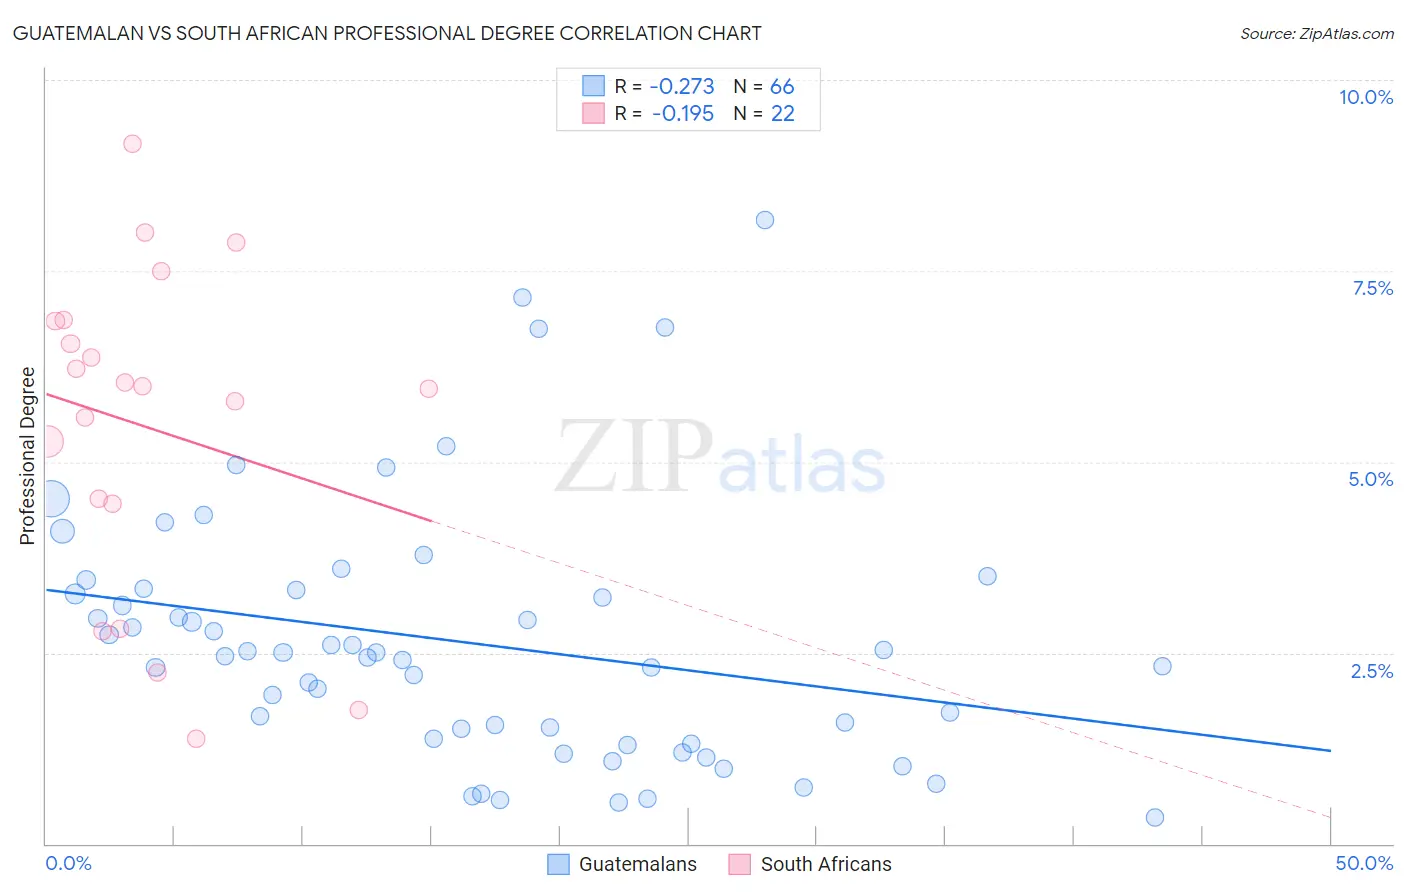
Guatemalan vs South African Professional Degree Correlation Chart
The statistical analysis conducted on geographies consisting of 408,165,670 people shows a weak negative correlation between the proportion of Guatemalans and percentage of population with at least professional degree education in the United States with a correlation coefficient (R) of -0.273 and weighted average of 3.5%. Similarly, the statistical analysis conducted on geographies consisting of 182,499,194 people shows a poor negative correlation between the proportion of South Africans and percentage of population with at least professional degree education in the United States with a correlation coefficient (R) of -0.195 and weighted average of 5.7%, a difference of 64.3%.
Professional Degree Correlation Summary
| Measurement | Guatemalan | South African |
| Minimum | 0.34% | 1.4% |
| Maximum | 8.2% | 9.2% |
| Range | 7.8% | 7.8% |
| Mean | 2.6% | 5.5% |
| Median | 2.5% | 6.0% |
| Interquartile 25% (IQ1) | 1.4% | 4.5% |
| Interquartile 75% (IQ3) | 3.3% | 6.8% |
| Interquartile Range (IQR) | 1.9% | 2.4% |
| Standard Deviation (Sample) | 1.7% | 2.1% |
| Standard Deviation (Population) | 1.7% | 2.1% |
Similar Demographics by Professional Degree
Demographics Similar to Guatemalans by Professional Degree
In terms of professional degree, the demographic groups most similar to Guatemalans are Chippewa (3.5%, a difference of 0.010%), Blackfeet (3.5%, a difference of 0.17%), Alaska Native (3.5%, a difference of 0.18%), Immigrants from El Salvador (3.5%, a difference of 0.22%), and Immigrants from Belize (3.5%, a difference of 0.25%).
| Demographics | Rating | Rank | Professional Degree |
| Immigrants | Caribbean | 0.5 /100 | #282 | Tragic 3.5% |
| Comanche | 0.4 /100 | #283 | Tragic 3.5% |
| Salvadorans | 0.4 /100 | #284 | Tragic 3.5% |
| Hondurans | 0.3 /100 | #285 | Tragic 3.5% |
| Haitians | 0.3 /100 | #286 | Tragic 3.5% |
| Immigrants | El Salvador | 0.3 /100 | #287 | Tragic 3.5% |
| Blackfeet | 0.3 /100 | #288 | Tragic 3.5% |
| Guatemalans | 0.3 /100 | #289 | Tragic 3.5% |
| Chippewa | 0.3 /100 | #290 | Tragic 3.5% |
| Alaska Natives | 0.3 /100 | #291 | Tragic 3.5% |
| Immigrants | Belize | 0.3 /100 | #292 | Tragic 3.5% |
| Immigrants | Honduras | 0.3 /100 | #293 | Tragic 3.5% |
| Paiute | 0.3 /100 | #294 | Tragic 3.4% |
| Immigrants | Guatemala | 0.2 /100 | #295 | Tragic 3.4% |
| Hawaiians | 0.2 /100 | #296 | Tragic 3.4% |
Demographics Similar to South Africans by Professional Degree
In terms of professional degree, the demographic groups most similar to South Africans are Immigrants from Malaysia (5.7%, a difference of 0.26%), Immigrants from Western Europe (5.7%, a difference of 0.38%), Bulgarian (5.7%, a difference of 0.59%), Immigrants from Kuwait (5.7%, a difference of 0.79%), and Immigrants from Europe (5.6%, a difference of 1.1%).
| Demographics | Rating | Rank | Professional Degree |
| Immigrants | Czechoslovakia | 100.0 /100 | #50 | Exceptional 5.8% |
| Immigrants | Greece | 100.0 /100 | #51 | Exceptional 5.8% |
| Immigrants | Serbia | 100.0 /100 | #52 | Exceptional 5.8% |
| Immigrants | Netherlands | 100.0 /100 | #53 | Exceptional 5.8% |
| Immigrants | Kuwait | 100.0 /100 | #54 | Exceptional 5.7% |
| Immigrants | Western Europe | 100.0 /100 | #55 | Exceptional 5.7% |
| Immigrants | Malaysia | 100.0 /100 | #56 | Exceptional 5.7% |
| South Africans | 100.0 /100 | #57 | Exceptional 5.7% |
| Bulgarians | 100.0 /100 | #58 | Exceptional 5.7% |
| Immigrants | Europe | 100.0 /100 | #59 | Exceptional 5.6% |
| Bolivians | 99.9 /100 | #60 | Exceptional 5.6% |
| Immigrants | Lithuania | 99.9 /100 | #61 | Exceptional 5.6% |
| Immigrants | Belarus | 99.9 /100 | #62 | Exceptional 5.5% |
| Asians | 99.9 /100 | #63 | Exceptional 5.5% |
| Immigrants | Asia | 99.9 /100 | #64 | Exceptional 5.5% |