Guatemalan vs Shoshone High School Diploma
COMPARE
Guatemalan
Shoshone
High School Diploma
High School Diploma Comparison
Guatemalans
Shoshone
82.0%
HIGH SCHOOL DIPLOMA
0.0/ 100
METRIC RATING
335th/ 347
METRIC RANK
88.3%
HIGH SCHOOL DIPLOMA
7.0/ 100
METRIC RATING
224th/ 347
METRIC RANK
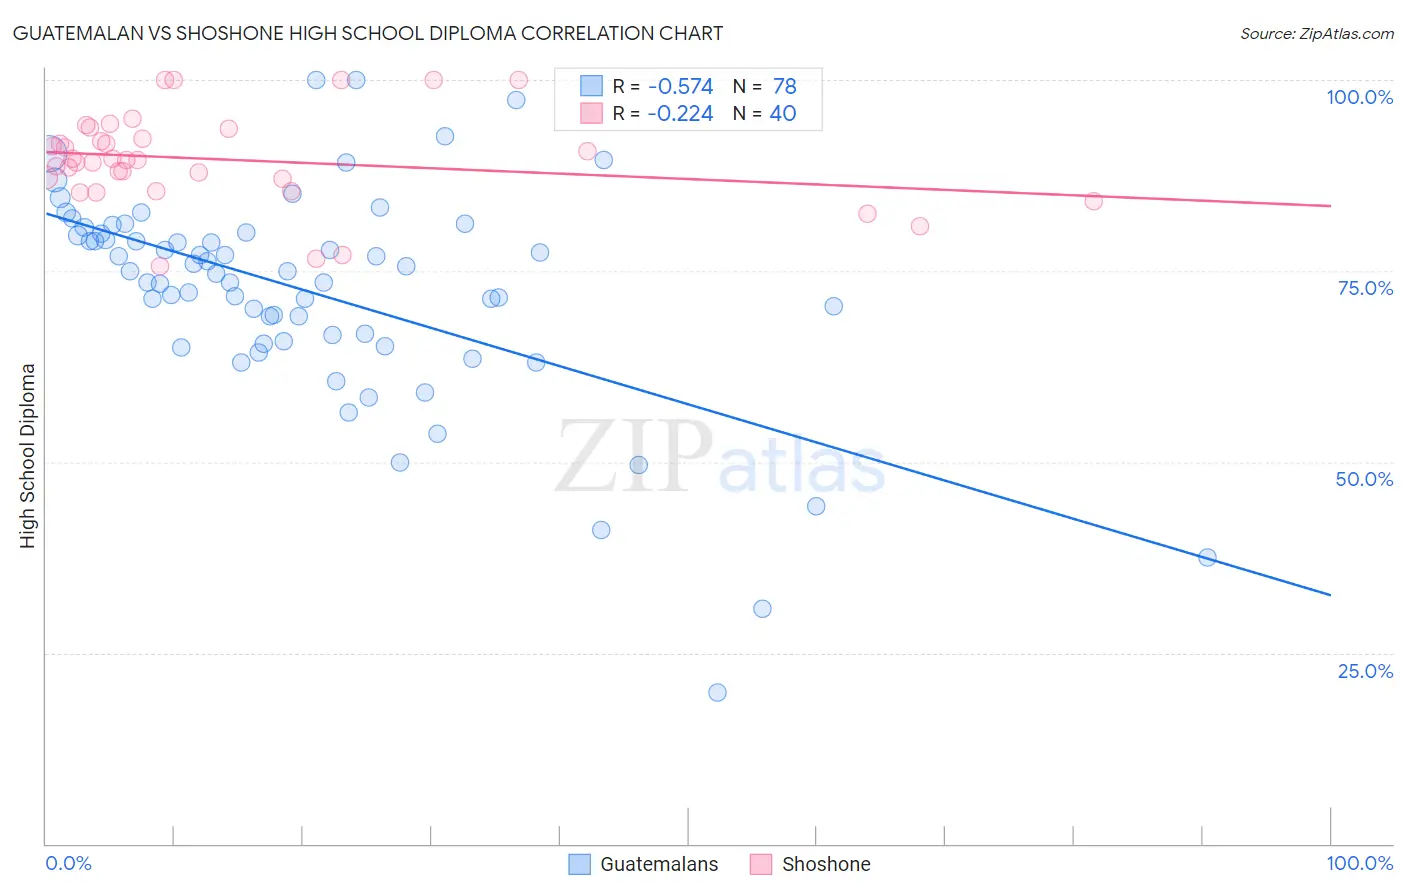
Guatemalan vs Shoshone High School Diploma Correlation Chart
The statistical analysis conducted on geographies consisting of 409,566,541 people shows a substantial negative correlation between the proportion of Guatemalans and percentage of population with at least high school diploma education in the United States with a correlation coefficient (R) of -0.574 and weighted average of 82.0%. Similarly, the statistical analysis conducted on geographies consisting of 66,627,351 people shows a weak negative correlation between the proportion of Shoshone and percentage of population with at least high school diploma education in the United States with a correlation coefficient (R) of -0.224 and weighted average of 88.3%, a difference of 7.7%.
High School Diploma Correlation Summary
| Measurement | Guatemalan | Shoshone |
| Minimum | 19.8% | 75.6% |
| Maximum | 100.0% | 100.0% |
| Range | 80.2% | 24.4% |
| Mean | 72.2% | 89.5% |
| Median | 74.8% | 89.5% |
| Interquartile 25% (IQ1) | 65.9% | 86.3% |
| Interquartile 75% (IQ3) | 79.9% | 92.9% |
| Interquartile Range (IQR) | 14.1% | 6.6% |
| Standard Deviation (Sample) | 14.2% | 6.1% |
| Standard Deviation (Population) | 14.1% | 6.0% |
Similar Demographics by High School Diploma
Demographics Similar to Guatemalans by High School Diploma
In terms of high school diploma, the demographic groups most similar to Guatemalans are Immigrants from Dominican Republic (82.0%, a difference of 0.010%), Tohono O'odham (82.1%, a difference of 0.11%), Immigrants from Yemen (81.8%, a difference of 0.15%), Immigrants from Latin America (82.1%, a difference of 0.22%), and Salvadoran (81.7%, a difference of 0.33%).
| Demographics | Rating | Rank | High School Diploma |
| Dominicans | 0.0 /100 | #328 | Tragic 82.9% |
| Hispanics or Latinos | 0.0 /100 | #329 | Tragic 82.9% |
| Immigrants | Azores | 0.0 /100 | #330 | Tragic 82.8% |
| Central Americans | 0.0 /100 | #331 | Tragic 82.5% |
| Immigrants | Honduras | 0.0 /100 | #332 | Tragic 82.5% |
| Immigrants | Latin America | 0.0 /100 | #333 | Tragic 82.1% |
| Tohono O'odham | 0.0 /100 | #334 | Tragic 82.1% |
| Guatemalans | 0.0 /100 | #335 | Tragic 82.0% |
| Immigrants | Dominican Republic | 0.0 /100 | #336 | Tragic 82.0% |
| Immigrants | Yemen | 0.0 /100 | #337 | Tragic 81.8% |
| Salvadorans | 0.0 /100 | #338 | Tragic 81.7% |
| Pima | 0.0 /100 | #339 | Tragic 81.6% |
| Houma | 0.0 /100 | #340 | Tragic 81.5% |
| Mexicans | 0.0 /100 | #341 | Tragic 81.4% |
| Immigrants | Guatemala | 0.0 /100 | #342 | Tragic 81.4% |
Demographics Similar to Shoshone by High School Diploma
In terms of high school diploma, the demographic groups most similar to Shoshone are Creek (88.3%, a difference of 0.010%), Colville (88.3%, a difference of 0.040%), Immigrants from Zaire (88.3%, a difference of 0.040%), Immigrants from Afghanistan (88.3%, a difference of 0.090%), and Uruguayan (88.2%, a difference of 0.090%).
| Demographics | Rating | Rank | High School Diploma |
| Immigrants | Africa | 10.6 /100 | #217 | Poor 88.4% |
| Immigrants | Bolivia | 10.3 /100 | #218 | Poor 88.4% |
| Costa Ricans | 9.6 /100 | #219 | Tragic 88.4% |
| Tongans | 9.5 /100 | #220 | Tragic 88.4% |
| Immigrants | Afghanistan | 8.6 /100 | #221 | Tragic 88.3% |
| Colville | 7.8 /100 | #222 | Tragic 88.3% |
| Immigrants | Zaire | 7.6 /100 | #223 | Tragic 88.3% |
| Shoshone | 7.0 /100 | #224 | Tragic 88.3% |
| Creek | 6.9 /100 | #225 | Tragic 88.3% |
| Uruguayans | 5.6 /100 | #226 | Tragic 88.2% |
| Immigrants | Liberia | 5.5 /100 | #227 | Tragic 88.2% |
| Kiowa | 5.3 /100 | #228 | Tragic 88.2% |
| Nigerians | 5.2 /100 | #229 | Tragic 88.2% |
| Blackfeet | 4.2 /100 | #230 | Tragic 88.1% |
| Colombians | 3.8 /100 | #231 | Tragic 88.1% |