Guatemalan vs Immigrants from Northern Africa College, Under 1 year
COMPARE
Guatemalan
Immigrants from Northern Africa
College, Under 1 year
College, Under 1 year Comparison
Guatemalans
Immigrants from Northern Africa
56.8%
COLLEGE, UNDER 1 YEAR
0.0/ 100
METRIC RATING
320th/ 347
METRIC RANK
67.2%
COLLEGE, UNDER 1 YEAR
92.7/ 100
METRIC RATING
123rd/ 347
METRIC RANK
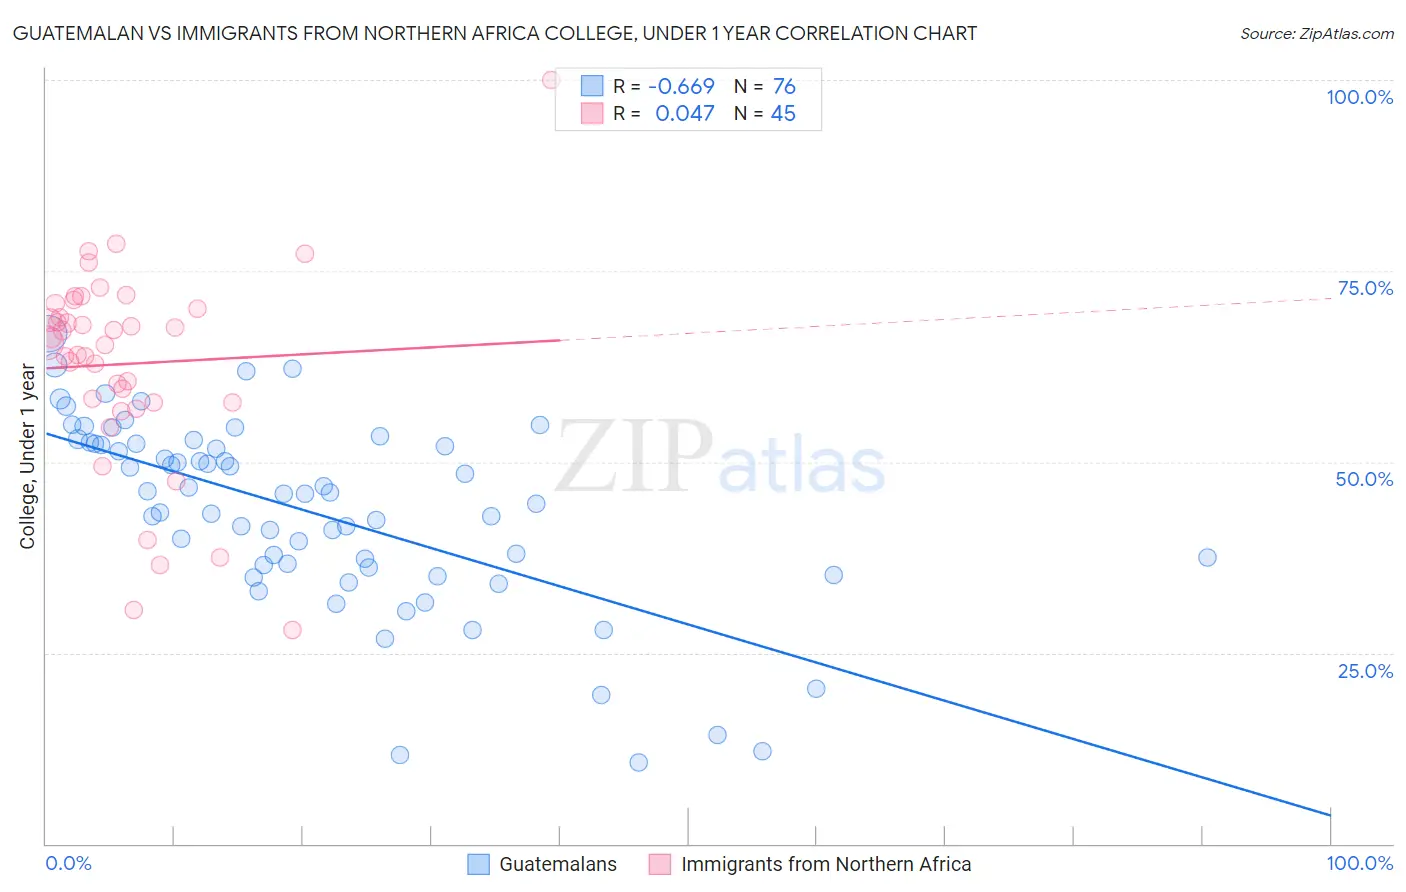
Guatemalan vs Immigrants from Northern Africa College, Under 1 year Correlation Chart
The statistical analysis conducted on geographies consisting of 409,563,856 people shows a significant negative correlation between the proportion of Guatemalans and percentage of population with at least college, under 1 year education in the United States with a correlation coefficient (R) of -0.669 and weighted average of 56.8%. Similarly, the statistical analysis conducted on geographies consisting of 321,198,131 people shows no correlation between the proportion of Immigrants from Northern Africa and percentage of population with at least college, under 1 year education in the United States with a correlation coefficient (R) of 0.047 and weighted average of 67.2%, a difference of 18.4%.
College, Under 1 year Correlation Summary
| Measurement | Guatemalan | Immigrants from Northern Africa |
| Minimum | 10.7% | 28.0% |
| Maximum | 66.9% | 100.0% |
| Range | 56.2% | 72.0% |
| Mean | 43.4% | 62.8% |
| Median | 45.8% | 65.6% |
| Interquartile 25% (IQ1) | 36.4% | 57.7% |
| Interquartile 75% (IQ3) | 52.4% | 70.4% |
| Interquartile Range (IQR) | 16.0% | 12.7% |
| Standard Deviation (Sample) | 12.4% | 13.3% |
| Standard Deviation (Population) | 12.3% | 13.2% |
Similar Demographics by College, Under 1 year
Demographics Similar to Guatemalans by College, Under 1 year
In terms of college, under 1 year, the demographic groups most similar to Guatemalans are Puerto Rican (56.8%, a difference of 0.060%), Native/Alaskan (56.6%, a difference of 0.26%), Immigrants from Haiti (56.9%, a difference of 0.27%), Hispanic or Latino (57.0%, a difference of 0.38%), and Immigrants from Caribbean (56.6%, a difference of 0.39%).
| Demographics | Rating | Rank | College, Under 1 year |
| Dutch West Indians | 0.0 /100 | #313 | Tragic 57.2% |
| Hopi | 0.0 /100 | #314 | Tragic 57.1% |
| Hondurans | 0.0 /100 | #315 | Tragic 57.1% |
| Menominee | 0.0 /100 | #316 | Tragic 57.0% |
| Hispanics or Latinos | 0.0 /100 | #317 | Tragic 57.0% |
| Immigrants | Haiti | 0.0 /100 | #318 | Tragic 56.9% |
| Puerto Ricans | 0.0 /100 | #319 | Tragic 56.8% |
| Guatemalans | 0.0 /100 | #320 | Tragic 56.8% |
| Natives/Alaskans | 0.0 /100 | #321 | Tragic 56.6% |
| Immigrants | Caribbean | 0.0 /100 | #322 | Tragic 56.6% |
| Immigrants | Honduras | 0.0 /100 | #323 | Tragic 56.5% |
| Immigrants | El Salvador | 0.0 /100 | #324 | Tragic 56.4% |
| Immigrants | Latin America | 0.0 /100 | #325 | Tragic 56.3% |
| Navajo | 0.0 /100 | #326 | Tragic 56.3% |
| Immigrants | Guatemala | 0.0 /100 | #327 | Tragic 56.2% |
Demographics Similar to Immigrants from Northern Africa by College, Under 1 year
In terms of college, under 1 year, the demographic groups most similar to Immigrants from Northern Africa are Arab (67.2%, a difference of 0.010%), Immigrants from Jordan (67.3%, a difference of 0.020%), Slovene (67.3%, a difference of 0.11%), Italian (67.2%, a difference of 0.13%), and Alsatian (67.1%, a difference of 0.19%).
| Demographics | Rating | Rank | College, Under 1 year |
| Immigrants | Nepal | 94.9 /100 | #116 | Exceptional 67.5% |
| Pakistanis | 94.8 /100 | #117 | Exceptional 67.5% |
| Immigrants | Ukraine | 94.7 /100 | #118 | Exceptional 67.5% |
| Lebanese | 94.6 /100 | #119 | Exceptional 67.5% |
| Serbians | 93.9 /100 | #120 | Exceptional 67.4% |
| Slovenes | 93.3 /100 | #121 | Exceptional 67.3% |
| Immigrants | Jordan | 92.8 /100 | #122 | Exceptional 67.3% |
| Immigrants | Northern Africa | 92.7 /100 | #123 | Exceptional 67.2% |
| Arabs | 92.6 /100 | #124 | Exceptional 67.2% |
| Italians | 91.8 /100 | #125 | Exceptional 67.2% |
| Alsatians | 91.3 /100 | #126 | Exceptional 67.1% |
| Czechs | 90.8 /100 | #127 | Exceptional 67.1% |
| Scottish | 90.2 /100 | #128 | Exceptional 67.0% |
| Immigrants | Eastern Africa | 89.5 /100 | #129 | Excellent 67.0% |
| Immigrants | Syria | 89.0 /100 | #130 | Excellent 66.9% |