Guamanian/Chamorro vs Venezuelan 10th Grade
COMPARE
Guamanian/Chamorro
Venezuelan
10th Grade
10th Grade Comparison
Guamanians/Chamorros
Venezuelans
93.6%
10TH GRADE
37.1/ 100
METRIC RATING
183rd/ 347
METRIC RANK
93.9%
10TH GRADE
69.5/ 100
METRIC RATING
163rd/ 347
METRIC RANK
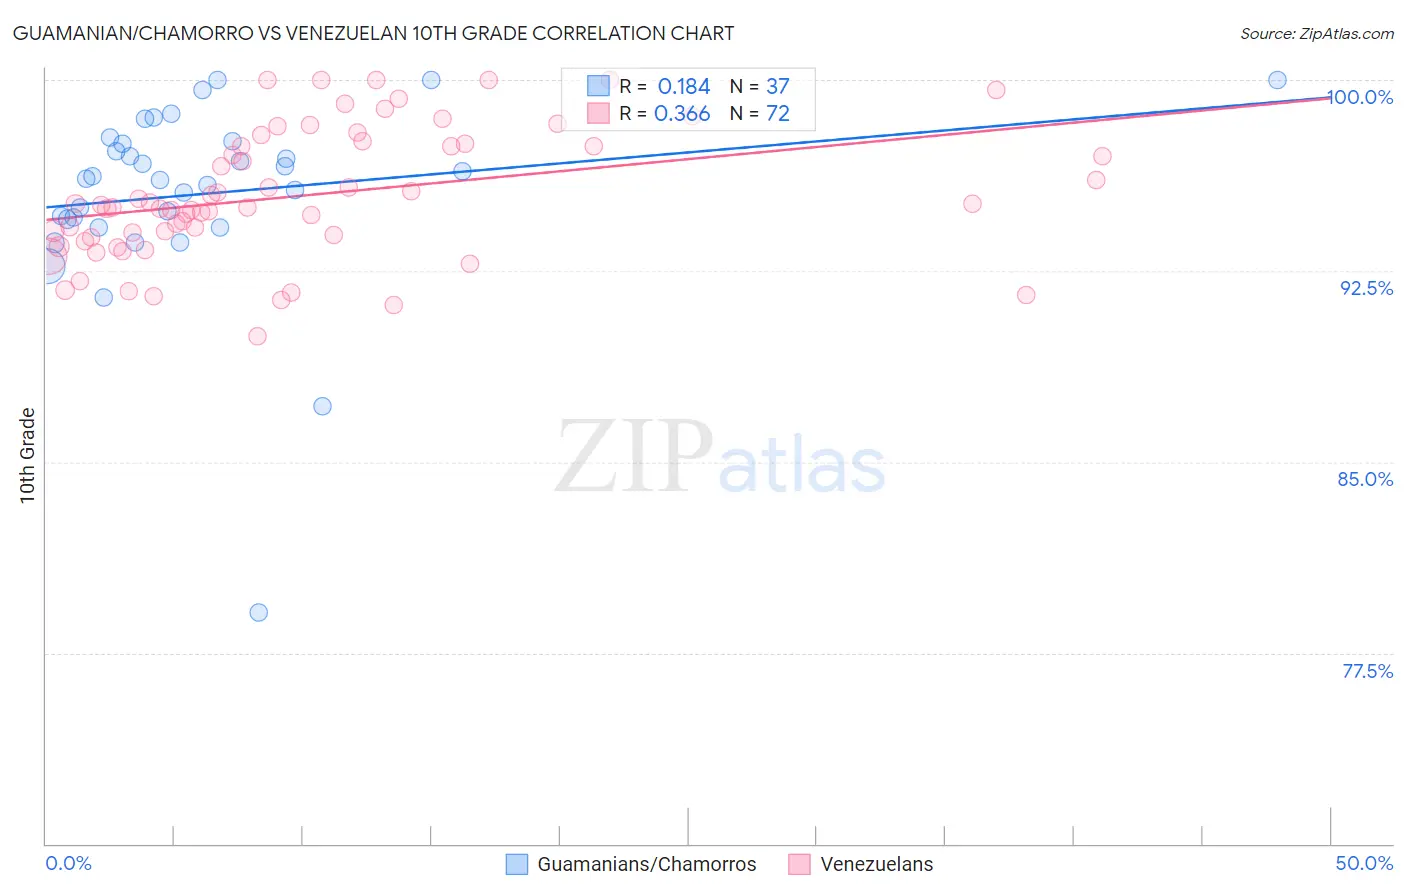
Guamanian/Chamorro vs Venezuelan 10th Grade Correlation Chart
The statistical analysis conducted on geographies consisting of 221,965,618 people shows a poor positive correlation between the proportion of Guamanians/Chamorros and percentage of population with at least 10th grade education in the United States with a correlation coefficient (R) of 0.184 and weighted average of 93.6%. Similarly, the statistical analysis conducted on geographies consisting of 306,323,887 people shows a mild positive correlation between the proportion of Venezuelans and percentage of population with at least 10th grade education in the United States with a correlation coefficient (R) of 0.366 and weighted average of 93.9%, a difference of 0.30%.
10th Grade Correlation Summary
| Measurement | Guamanian/Chamorro | Venezuelan |
| Minimum | 79.1% | 89.9% |
| Maximum | 100.0% | 100.0% |
| Range | 20.9% | 10.1% |
| Mean | 95.5% | 95.5% |
| Median | 96.1% | 95.0% |
| Interquartile 25% (IQ1) | 94.4% | 93.9% |
| Interquartile 75% (IQ3) | 97.5% | 97.5% |
| Interquartile Range (IQR) | 3.2% | 3.6% |
| Standard Deviation (Sample) | 3.8% | 2.5% |
| Standard Deviation (Population) | 3.7% | 2.5% |
Demographics Similar to Guamanians/Chamorros and Venezuelans by 10th Grade
In terms of 10th grade, the demographic groups most similar to Guamanians/Chamorros are Colville (93.6%, a difference of 0.020%), Immigrants from Northern Africa (93.7%, a difference of 0.040%), Blackfeet (93.7%, a difference of 0.050%), Sierra Leonean (93.7%, a difference of 0.080%), and Paraguayan (93.7%, a difference of 0.080%). Similarly, the demographic groups most similar to Venezuelans are Iraqi (93.9%, a difference of 0.010%), Brazilian (93.8%, a difference of 0.060%), Immigrants from Iraq (93.8%, a difference of 0.070%), Immigrants from Egypt (93.8%, a difference of 0.070%), and Alsatian (93.8%, a difference of 0.10%).
| Demographics | Rating | Rank | 10th Grade |
| Venezuelans | 69.5 /100 | #163 | Good 93.9% |
| Iraqis | 68.1 /100 | #164 | Good 93.9% |
| Brazilians | 63.6 /100 | #165 | Good 93.8% |
| Immigrants | Iraq | 63.0 /100 | #166 | Good 93.8% |
| Immigrants | Egypt | 62.3 /100 | #167 | Good 93.8% |
| Alsatians | 59.4 /100 | #168 | Average 93.8% |
| Immigrants | Spain | 55.9 /100 | #169 | Average 93.8% |
| Immigrants | Venezuela | 53.9 /100 | #170 | Average 93.8% |
| Immigrants | Albania | 52.4 /100 | #171 | Average 93.8% |
| French American Indians | 50.9 /100 | #172 | Average 93.7% |
| Spaniards | 50.3 /100 | #173 | Average 93.7% |
| Argentineans | 50.0 /100 | #174 | Average 93.7% |
| Immigrants | Nepal | 49.6 /100 | #175 | Average 93.7% |
| Immigrants | Argentina | 47.1 /100 | #176 | Average 93.7% |
| Immigrants | Lebanon | 47.1 /100 | #177 | Average 93.7% |
| Sierra Leoneans | 46.1 /100 | #178 | Average 93.7% |
| Paraguayans | 45.3 /100 | #179 | Average 93.7% |
| Blackfeet | 42.8 /100 | #180 | Average 93.7% |
| Immigrants | Northern Africa | 41.6 /100 | #181 | Average 93.7% |
| Colville | 38.8 /100 | #182 | Fair 93.6% |
| Guamanians/Chamorros | 37.1 /100 | #183 | Fair 93.6% |