Guamanian/Chamorro vs British West Indian High School Diploma
COMPARE
Guamanian/Chamorro
British West Indian
High School Diploma
High School Diploma Comparison
Guamanians/Chamorros
British West Indians
88.9%
HIGH SCHOOL DIPLOMA
35.5/ 100
METRIC RATING
187th/ 347
METRIC RANK
85.9%
HIGH SCHOOL DIPLOMA
0.0/ 100
METRIC RATING
293rd/ 347
METRIC RANK
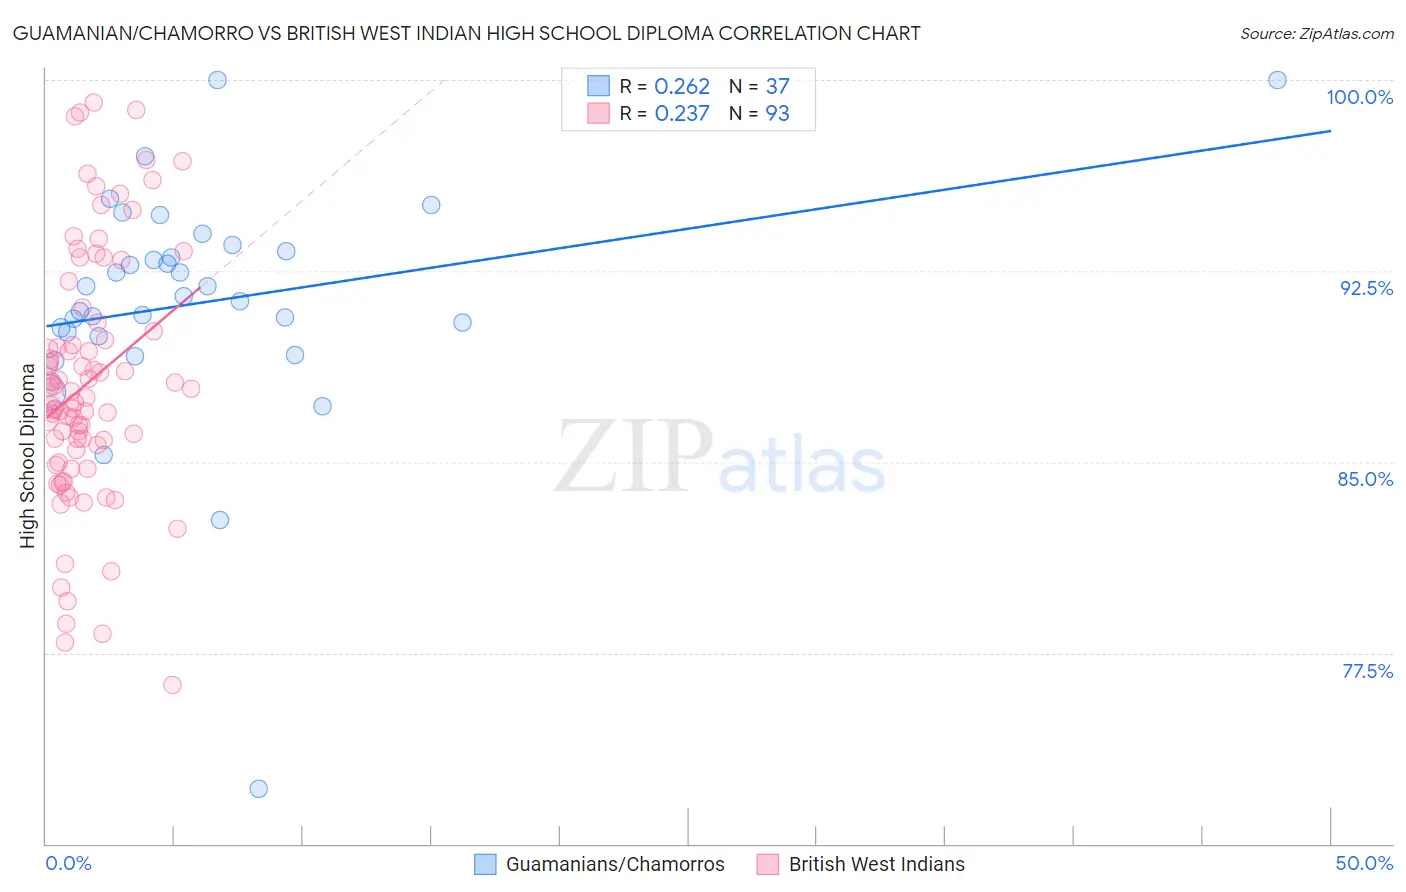
Guamanian/Chamorro vs British West Indian High School Diploma Correlation Chart
The statistical analysis conducted on geographies consisting of 221,965,618 people shows a weak positive correlation between the proportion of Guamanians/Chamorros and percentage of population with at least high school diploma education in the United States with a correlation coefficient (R) of 0.262 and weighted average of 88.9%. Similarly, the statistical analysis conducted on geographies consisting of 152,698,597 people shows a weak positive correlation between the proportion of British West Indians and percentage of population with at least high school diploma education in the United States with a correlation coefficient (R) of 0.237 and weighted average of 85.9%, a difference of 3.6%.
High School Diploma Correlation Summary
| Measurement | Guamanian/Chamorro | British West Indian |
| Minimum | 72.2% | 76.2% |
| Maximum | 100.0% | 99.1% |
| Range | 27.8% | 22.9% |
| Mean | 91.3% | 88.1% |
| Median | 91.5% | 87.5% |
| Interquartile 25% (IQ1) | 90.0% | 85.2% |
| Interquartile 75% (IQ3) | 93.4% | 90.3% |
| Interquartile Range (IQR) | 3.4% | 5.1% |
| Standard Deviation (Sample) | 4.7% | 4.9% |
| Standard Deviation (Population) | 4.6% | 4.9% |
Similar Demographics by High School Diploma
Demographics Similar to Guamanians/Chamorros by High School Diploma
In terms of high school diploma, the demographic groups most similar to Guamanians/Chamorros are Immigrants from Eastern Africa (88.9%, a difference of 0.0%), Ethiopian (89.0%, a difference of 0.020%), Immigrants from Sudan (88.9%, a difference of 0.040%), Immigrants from Uganda (88.9%, a difference of 0.050%), and Immigrants from Syria (89.0%, a difference of 0.060%).
| Demographics | Rating | Rank | High School Diploma |
| Bolivians | 45.2 /100 | #180 | Average 89.1% |
| Venezuelans | 43.6 /100 | #181 | Average 89.1% |
| Spaniards | 43.4 /100 | #182 | Average 89.1% |
| Potawatomi | 42.5 /100 | #183 | Average 89.0% |
| Immigrants | Syria | 39.2 /100 | #184 | Fair 89.0% |
| Ethiopians | 37.0 /100 | #185 | Fair 89.0% |
| Immigrants | Eastern Africa | 35.8 /100 | #186 | Fair 88.9% |
| Guamanians/Chamorros | 35.5 /100 | #187 | Fair 88.9% |
| Immigrants | Sudan | 33.4 /100 | #188 | Fair 88.9% |
| Immigrants | Uganda | 32.6 /100 | #189 | Fair 88.9% |
| Immigrants | Chile | 31.9 /100 | #190 | Fair 88.9% |
| Immigrants | Ethiopia | 30.9 /100 | #191 | Fair 88.9% |
| Moroccans | 29.5 /100 | #192 | Fair 88.8% |
| Immigrants | Oceania | 26.9 /100 | #193 | Fair 88.8% |
| Immigrants | Venezuela | 25.8 /100 | #194 | Fair 88.8% |
Demographics Similar to British West Indians by High School Diploma
In terms of high school diploma, the demographic groups most similar to British West Indians are Japanese (85.9%, a difference of 0.020%), Haitian (85.9%, a difference of 0.030%), Immigrants from Fiji (85.8%, a difference of 0.040%), Immigrants (85.8%, a difference of 0.050%), and Fijian (86.0%, a difference of 0.16%).
| Demographics | Rating | Rank | High School Diploma |
| Immigrants | St. Vincent and the Grenadines | 0.0 /100 | #286 | Tragic 86.2% |
| Ute | 0.0 /100 | #287 | Tragic 86.2% |
| Immigrants | Vietnam | 0.0 /100 | #288 | Tragic 86.2% |
| Yup'ik | 0.0 /100 | #289 | Tragic 86.1% |
| Fijians | 0.0 /100 | #290 | Tragic 86.0% |
| Haitians | 0.0 /100 | #291 | Tragic 85.9% |
| Japanese | 0.0 /100 | #292 | Tragic 85.9% |
| British West Indians | 0.0 /100 | #293 | Tragic 85.9% |
| Immigrants | Fiji | 0.0 /100 | #294 | Tragic 85.8% |
| Immigrants | Immigrants | 0.0 /100 | #295 | Tragic 85.8% |
| Immigrants | Cambodia | 0.0 /100 | #296 | Tragic 85.6% |
| Immigrants | Grenada | 0.0 /100 | #297 | Tragic 85.6% |
| Natives/Alaskans | 0.0 /100 | #298 | Tragic 85.6% |
| Guyanese | 0.0 /100 | #299 | Tragic 85.5% |
| Immigrants | Bangladesh | 0.0 /100 | #300 | Tragic 85.5% |