Ghanaian vs Ugandan 12th Grade, No Diploma
COMPARE
Ghanaian
Ugandan
12th Grade, No Diploma
12th Grade, No Diploma Comparison
Ghanaians
Ugandans
90.0%
12TH GRADE, NO DIPLOMA
1.3/ 100
METRIC RATING
246th/ 347
METRIC RANK
91.5%
12TH GRADE, NO DIPLOMA
79.0/ 100
METRIC RATING
149th/ 347
METRIC RANK
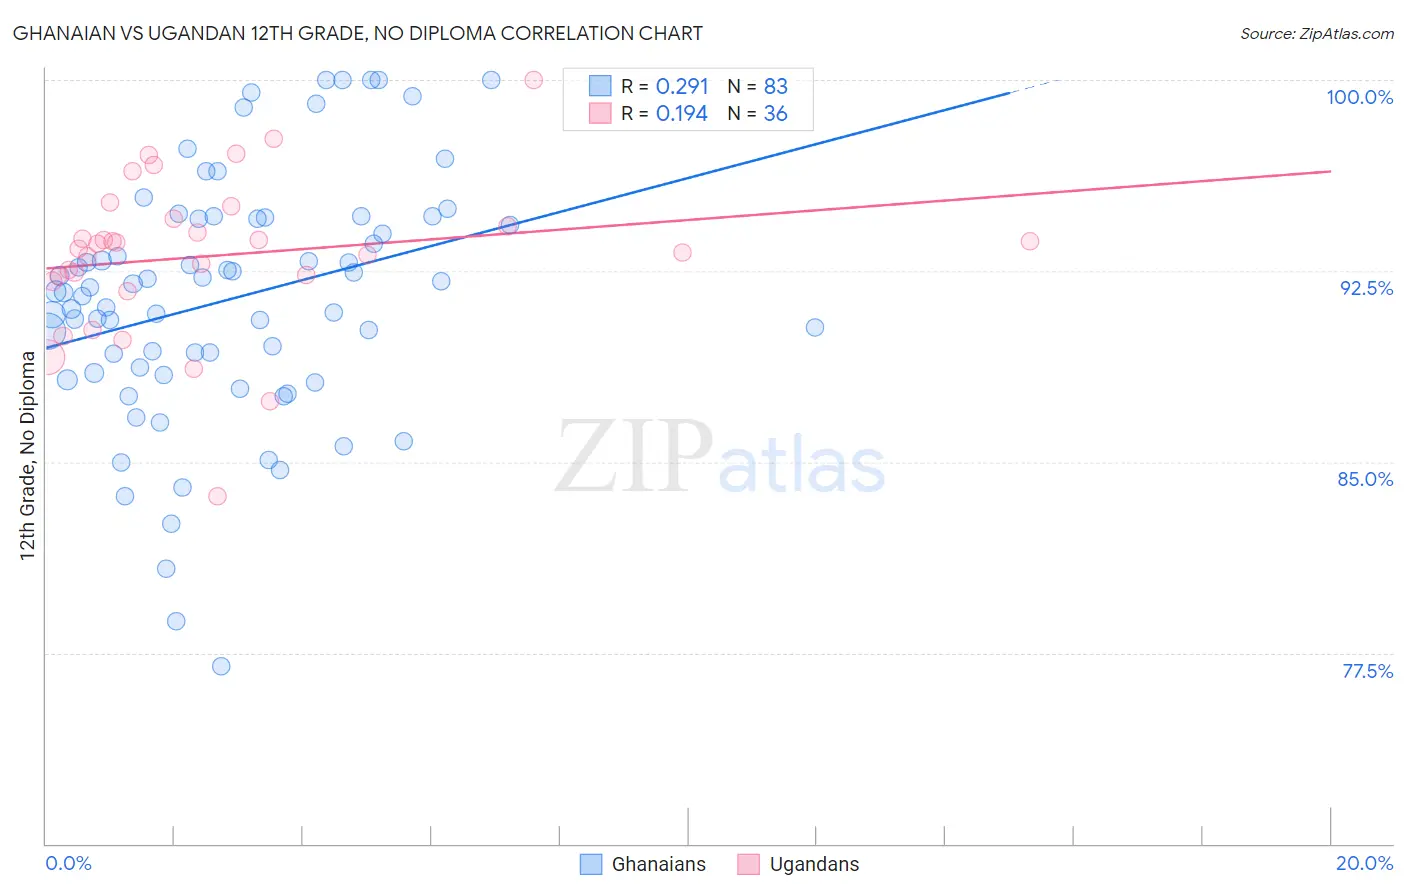
Ghanaian vs Ugandan 12th Grade, No Diploma Correlation Chart
The statistical analysis conducted on geographies consisting of 190,714,079 people shows a weak positive correlation between the proportion of Ghanaians and percentage of population with at least 12th grade (no diploma) education in the United States with a correlation coefficient (R) of 0.291 and weighted average of 90.0%. Similarly, the statistical analysis conducted on geographies consisting of 93,991,892 people shows a poor positive correlation between the proportion of Ugandans and percentage of population with at least 12th grade (no diploma) education in the United States with a correlation coefficient (R) of 0.194 and weighted average of 91.5%, a difference of 1.8%.
12th Grade, No Diploma Correlation Summary
| Measurement | Ghanaian | Ugandan |
| Minimum | 77.0% | 83.7% |
| Maximum | 100.0% | 100.0% |
| Range | 23.0% | 16.3% |
| Mean | 91.4% | 93.1% |
| Median | 91.7% | 93.5% |
| Interquartile 25% (IQ1) | 88.5% | 92.2% |
| Interquartile 75% (IQ3) | 94.6% | 94.4% |
| Interquartile Range (IQR) | 6.1% | 2.2% |
| Standard Deviation (Sample) | 4.8% | 3.1% |
| Standard Deviation (Population) | 4.8% | 3.0% |
Similar Demographics by 12th Grade, No Diploma
Demographics Similar to Ghanaians by 12th Grade, No Diploma
In terms of 12th grade, no diploma, the demographic groups most similar to Ghanaians are Immigrants from Uruguay (90.0%, a difference of 0.010%), Immigrants from Nigeria (89.9%, a difference of 0.010%), Crow (90.0%, a difference of 0.050%), Taiwanese (90.0%, a difference of 0.050%), and Immigrants from Costa Rica (90.0%, a difference of 0.060%).
| Demographics | Rating | Rank | 12th Grade, No Diploma |
| Sub-Saharan Africans | 1.9 /100 | #239 | Tragic 90.1% |
| Kiowa | 1.7 /100 | #240 | Tragic 90.0% |
| Immigrants | Middle Africa | 1.7 /100 | #241 | Tragic 90.0% |
| Immigrants | Costa Rica | 1.6 /100 | #242 | Tragic 90.0% |
| Crow | 1.5 /100 | #243 | Tragic 90.0% |
| Taiwanese | 1.5 /100 | #244 | Tragic 90.0% |
| Immigrants | Uruguay | 1.4 /100 | #245 | Tragic 90.0% |
| Ghanaians | 1.3 /100 | #246 | Tragic 90.0% |
| Immigrants | Nigeria | 1.3 /100 | #247 | Tragic 89.9% |
| Comanche | 1.1 /100 | #248 | Tragic 89.9% |
| Senegalese | 1.1 /100 | #249 | Tragic 89.9% |
| Immigrants | Eritrea | 1.0 /100 | #250 | Tragic 89.9% |
| Spanish Americans | 0.9 /100 | #251 | Tragic 89.9% |
| Bahamians | 0.9 /100 | #252 | Tragic 89.9% |
| Choctaw | 0.7 /100 | #253 | Tragic 89.8% |
Demographics Similar to Ugandans by 12th Grade, No Diploma
In terms of 12th grade, no diploma, the demographic groups most similar to Ugandans are Paraguayan (91.5%, a difference of 0.0%), Chippewa (91.5%, a difference of 0.0%), Immigrants from Brazil (91.5%, a difference of 0.010%), Pakistani (91.5%, a difference of 0.010%), and Indian (Asian) (91.5%, a difference of 0.010%).
| Demographics | Rating | Rank | 12th Grade, No Diploma |
| Immigrants | Venezuela | 80.9 /100 | #142 | Excellent 91.6% |
| Immigrants | Argentina | 80.7 /100 | #143 | Excellent 91.6% |
| Immigrants | Spain | 80.1 /100 | #144 | Excellent 91.6% |
| Immigrants | Lebanon | 80.0 /100 | #145 | Excellent 91.6% |
| Immigrants | Brazil | 79.8 /100 | #146 | Good 91.5% |
| Pakistanis | 79.6 /100 | #147 | Good 91.5% |
| Indians (Asian) | 79.4 /100 | #148 | Good 91.5% |
| Ugandans | 79.0 /100 | #149 | Good 91.5% |
| Paraguayans | 78.9 /100 | #150 | Good 91.5% |
| Chippewa | 78.8 /100 | #151 | Good 91.5% |
| Kenyans | 77.4 /100 | #152 | Good 91.5% |
| Iraqis | 75.3 /100 | #153 | Good 91.5% |
| Immigrants | Kenya | 73.9 /100 | #154 | Good 91.5% |
| Immigrants | Iraq | 73.0 /100 | #155 | Good 91.4% |
| Asians | 71.9 /100 | #156 | Good 91.4% |