Ghanaian vs Osage High School Diploma
COMPARE
Ghanaian
Osage
High School Diploma
High School Diploma Comparison
Ghanaians
Osage
87.7%
HIGH SCHOOL DIPLOMA
1.4/ 100
METRIC RATING
251st/ 347
METRIC RANK
89.1%
HIGH SCHOOL DIPLOMA
48.9/ 100
METRIC RATING
176th/ 347
METRIC RANK
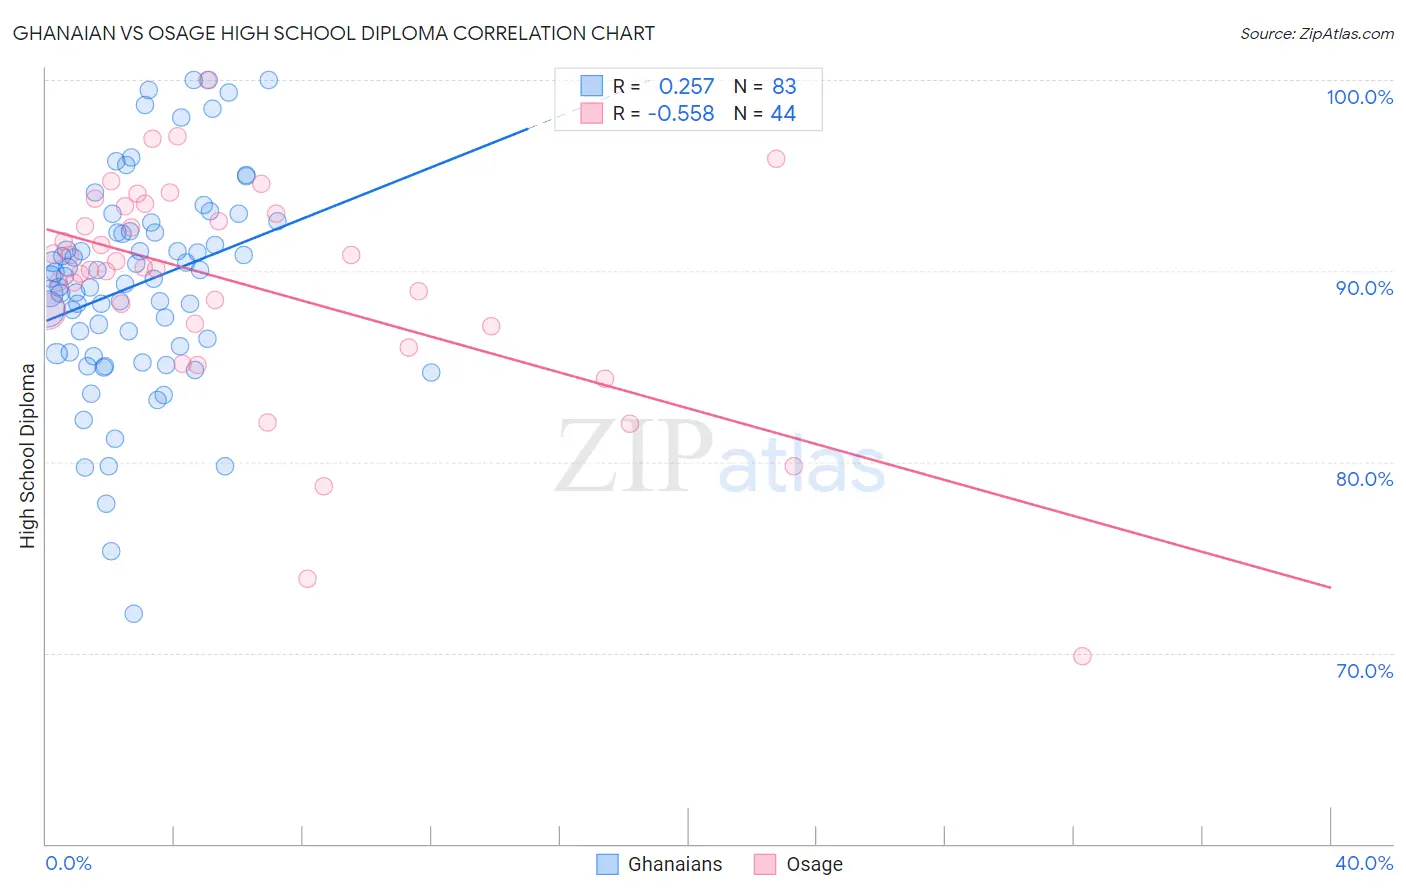
Ghanaian vs Osage High School Diploma Correlation Chart
The statistical analysis conducted on geographies consisting of 190,714,079 people shows a weak positive correlation between the proportion of Ghanaians and percentage of population with at least high school diploma education in the United States with a correlation coefficient (R) of 0.257 and weighted average of 87.7%. Similarly, the statistical analysis conducted on geographies consisting of 91,808,913 people shows a substantial negative correlation between the proportion of Osage and percentage of population with at least high school diploma education in the United States with a correlation coefficient (R) of -0.558 and weighted average of 89.1%, a difference of 1.6%.
High School Diploma Correlation Summary
| Measurement | Ghanaian | Osage |
| Minimum | 72.0% | 69.8% |
| Maximum | 100.0% | 100.0% |
| Range | 28.0% | 30.2% |
| Mean | 89.3% | 89.3% |
| Median | 89.7% | 90.1% |
| Interquartile 25% (IQ1) | 85.7% | 87.2% |
| Interquartile 75% (IQ3) | 92.1% | 93.2% |
| Interquartile Range (IQR) | 6.3% | 6.0% |
| Standard Deviation (Sample) | 5.5% | 5.9% |
| Standard Deviation (Population) | 5.5% | 5.8% |
Similar Demographics by High School Diploma
Demographics Similar to Ghanaians by High School Diploma
In terms of high school diploma, the demographic groups most similar to Ghanaians are Senegalese (87.7%, a difference of 0.040%), Immigrants from Nigeria (87.7%, a difference of 0.040%), Spanish American (87.7%, a difference of 0.050%), Immigrants from South America (87.6%, a difference of 0.060%), and Immigrants from Eritrea (87.8%, a difference of 0.090%).
| Demographics | Rating | Rank | High School Diploma |
| Choctaw | 1.9 /100 | #244 | Tragic 87.8% |
| Peruvians | 1.9 /100 | #245 | Tragic 87.8% |
| Immigrants | Eritrea | 1.7 /100 | #246 | Tragic 87.8% |
| Immigrants | Costa Rica | 1.7 /100 | #247 | Tragic 87.8% |
| Spanish Americans | 1.5 /100 | #248 | Tragic 87.7% |
| Senegalese | 1.5 /100 | #249 | Tragic 87.7% |
| Immigrants | Nigeria | 1.5 /100 | #250 | Tragic 87.7% |
| Ghanaians | 1.4 /100 | #251 | Tragic 87.7% |
| Immigrants | South America | 1.2 /100 | #252 | Tragic 87.6% |
| Immigrants | Uruguay | 1.0 /100 | #253 | Tragic 87.6% |
| Immigrants | Colombia | 1.0 /100 | #254 | Tragic 87.6% |
| Immigrants | Senegal | 0.9 /100 | #255 | Tragic 87.6% |
| Africans | 0.7 /100 | #256 | Tragic 87.5% |
| Bahamians | 0.7 /100 | #257 | Tragic 87.5% |
| Immigrants | Ghana | 0.5 /100 | #258 | Tragic 87.4% |
Demographics Similar to Osage by High School Diploma
In terms of high school diploma, the demographic groups most similar to Osage are Immigrants from Western Asia (89.1%, a difference of 0.0%), Sudanese (89.1%, a difference of 0.010%), Sierra Leonean (89.1%, a difference of 0.010%), Immigrants from Indonesia (89.1%, a difference of 0.020%), and Hmong (89.1%, a difference of 0.020%).
| Demographics | Rating | Rank | High School Diploma |
| Iroquois | 55.1 /100 | #169 | Average 89.2% |
| Immigrants | Morocco | 53.3 /100 | #170 | Average 89.2% |
| Spanish | 52.9 /100 | #171 | Average 89.2% |
| Immigrants | Nonimmigrants | 51.8 /100 | #172 | Average 89.2% |
| Immigrants | Indonesia | 50.3 /100 | #173 | Average 89.1% |
| Hmong | 50.0 /100 | #174 | Average 89.1% |
| Immigrants | Western Asia | 49.0 /100 | #175 | Average 89.1% |
| Osage | 48.9 /100 | #176 | Average 89.1% |
| Sudanese | 48.5 /100 | #177 | Average 89.1% |
| Sierra Leoneans | 48.4 /100 | #178 | Average 89.1% |
| Americans | 47.2 /100 | #179 | Average 89.1% |
| Bolivians | 45.2 /100 | #180 | Average 89.1% |
| Venezuelans | 43.6 /100 | #181 | Average 89.1% |
| Spaniards | 43.4 /100 | #182 | Average 89.1% |
| Potawatomi | 42.5 /100 | #183 | Average 89.0% |