Ghanaian vs Immigrants from South Eastern Asia 1st Grade

COMPARE

Ghanaian
Race
Ancestry
AfghanAfricanAlaska NativeAlaskan AthabascanAlbanianAleutAlsatianAmericanApacheArabArapahoArgentineanArmenianAssyrian/Chaldean/SyriacAustralianAustrianBahamianBangladeshiBarbadianBasqueBelgianBelizeanBermudanBhutaneseBlackfeetBolivianBrazilianBritishBritish West IndianBulgarianBurmeseCajunCambodianCanadianCape VerdeanCarpatho RusynCelticCentral AmericanCentral American IndianCherokeeCheyenneChickasawChileanChineseChippewaChoctawColombianColvilleComancheCosta RicanCreeCreekCroatianCrowCubanCypriotCzechCzechoslovakianDanishDelawareDominicanDutchDutch West IndianEastern EuropeanEcuadorianEgyptianEnglishEstonianEthiopianEuropeanFijianFilipinoFinnishFrenchFrench American IndianFrench CanadianGermanGerman RussianGhanaianGreekGuamanian/ChamorroGuatemalanGuyaneseHaitianHmongHonduranHopiHoumaHungarianIcelanderIndian (Asian)IndonesianInupiatIranianIraqiIrishIroquoisIsraeliItalianJamaicanJapaneseJordanianKenyanKiowaKoreanLaotianLatvianLebaneseLiberianLithuanianLumbeeLuxembourgerMacedonianMalaysianMalteseMarshalleseMenomineeMexicanMexican American IndianMongolianMoroccanNative HawaiianNavajoNepaleseNew ZealanderNicaraguanNigerianNorthern EuropeanNorwegianOkinawanOsageOttawaPaiutePakistaniPalestinianPanamanianParaguayanPennsylvania GermanPeruvianPimaPolishPortuguesePotawatomiPuebloPuerto RicanPuget Sound SalishRomanianRussianSalvadoranSamoanScandinavianScotch-IrishScottishSeminoleSenegaleseSerbianShoshoneSierra LeoneanSiouxSlavicSlovakSloveneSomaliSouth AfricanSouth AmericanSouth American IndianSoviet UnionSpaniardSpanishSpanish AmericanSpanish American IndianSri LankanSubsaharan AfricanSudaneseSwedishSwissSyrianTaiwaneseThaiTlingit-HaidaTohono O'OdhamTonganTrinidadian and TobagonianTsimshianTurkishU.S. Virgin IslanderUgandanUkrainianUruguayanUteVenezuelanVietnameseWelshWest IndianYakamaYaquiYugoslavianYumanYup'ikZimbabwean
Immigration
NonimmigrantsImmigrantsAfghanistanAfricaAlbaniaArgentinaArmeniaAsiaAustraliaAustriaBahamasBangladeshBarbadosBelarusBelgiumBelizeBoliviaBosnia and HerzegovinaBrazilBulgariaBurma/MyanmarCabo VerdeCambodiaCameroonCanadaCaribbeanCentral AmericaChileChinaColombiaCongoCosta RicaCroatiaCubaCzechoslovakiaDenmarkDominicaDominican RepublicEastern AfricaEastern AsiaEastern EuropeEcuadorEgyptEl SalvadorEnglandEritreaEthiopiaEuropeFijiFranceGermanyGhanaGreeceGrenadaGuatemalaGuyanaHaitiHondurasHong KongHungaryIndiaIndonesiaIranIraqIrelandIsraelItalyJamaicaJapanJordanKazakhstanKenyaKoreaKuwaitLaosLatin AmericaLatviaLebanonLiberiaLithuaniaMalaysiaMexicoMicronesiaMiddle AfricaMoldovaMoroccoNepalNetherlandsNicaraguaNigeriaNorth AmericaNorth MacedoniaNorthern AfricaNorthern EuropeNorwayOceaniaPakistanPanamaPeruPhilippinesPolandPortugalRomaniaRussiaSaudi ArabiaScotlandSenegalSerbiaSierra LeoneSingaporeSomaliaSouth AfricaSouth AmericaSouth Central AsiaSouthern EuropeSpainSri LankaSt. Vincent and the GrenadinesSudanSwedenSwitzerlandSyriaTaiwanThailandTrinidad and TobagoTurkeyUgandaUkraineUruguayUzbekistanVenezuelaVietnamWest IndiesWestern AfricaWestern AsiaWestern EuropeYemenZaireZimbabweAzores
Immigrants from South Eastern Asia
Race
Ancestry
AfghanAfricanAlaska NativeAlaskan AthabascanAlbanianAleutAlsatianAmericanApacheArabArapahoArgentineanArmenianAssyrian/Chaldean/SyriacAustralianAustrianBahamianBangladeshiBarbadianBasqueBelgianBelizeanBermudanBhutaneseBlackfeetBolivianBrazilianBritishBritish West IndianBulgarianBurmeseCajunCambodianCanadianCape VerdeanCarpatho RusynCelticCentral AmericanCentral American IndianCherokeeCheyenneChickasawChileanChineseChippewaChoctawColombianColvilleComancheCosta RicanCreeCreekCroatianCrowCubanCypriotCzechCzechoslovakianDanishDelawareDominicanDutchDutch West IndianEastern EuropeanEcuadorianEgyptianEnglishEstonianEthiopianEuropeanFijianFilipinoFinnishFrenchFrench American IndianFrench CanadianGermanGerman RussianGreekGuamanian/ChamorroGuatemalanGuyaneseHaitianHmongHonduranHopiHoumaHungarianIcelanderIndian (Asian)IndonesianInupiatIranianIraqiIrishIroquoisIsraeliItalianJamaicanJapaneseJordanianKenyanKiowaKoreanLaotianLatvianLebaneseLiberianLithuanianLumbeeLuxembourgerMacedonianMalaysianMalteseMarshalleseMenomineeMexicanMexican American IndianMongolianMoroccanNative HawaiianNavajoNepaleseNew ZealanderNicaraguanNigerianNorthern EuropeanNorwegianOkinawanOsageOttawaPaiutePakistaniPalestinianPanamanianParaguayanPennsylvania GermanPeruvianPimaPolishPortuguesePotawatomiPuebloPuerto RicanPuget Sound SalishRomanianRussianSalvadoranSamoanScandinavianScotch-IrishScottishSeminoleSenegaleseSerbianShoshoneSierra LeoneanSiouxSlavicSlovakSloveneSomaliSouth AfricanSouth AmericanSouth American IndianSoviet UnionSpaniardSpanishSpanish AmericanSpanish American IndianSri LankanSubsaharan AfricanSudaneseSwedishSwissSyrianTaiwaneseThaiTlingit-HaidaTohono O'OdhamTonganTrinidadian and TobagonianTsimshianTurkishU.S. Virgin IslanderUgandanUkrainianUruguayanUteVenezuelanVietnameseWelshWest IndianYakamaYaquiYugoslavianYumanYup'ikZimbabwean
Immigration
NonimmigrantsImmigrantsAfghanistanAfricaAlbaniaArgentinaArmeniaAsiaAustraliaAustriaBahamasBangladeshBarbadosBelarusBelgiumBelizeBoliviaBosnia and HerzegovinaBrazilBulgariaBurma/MyanmarCabo VerdeCambodiaCameroonCanadaCaribbeanCentral AmericaChileChinaColombiaCongoCosta RicaCroatiaCubaCzechoslovakiaDenmarkDominicaDominican RepublicEastern AfricaEastern AsiaEastern EuropeEcuadorEgyptEl SalvadorEnglandEritreaEthiopiaEuropeFijiFranceGermanyGhanaGreeceGrenadaGuatemalaGuyanaHaitiHondurasHong KongHungaryIndiaIndonesiaIranIraqIrelandIsraelItalyJamaicaJapanJordanKazakhstanKenyaKoreaKuwaitLaosLatin AmericaLatviaLebanonLiberiaLithuaniaMalaysiaMexicoMicronesiaMiddle AfricaMoldovaMoroccoNepalNetherlandsNicaraguaNigeriaNorth AmericaNorth MacedoniaNorthern AfricaNorthern EuropeNorwayOceaniaPakistanPanamaPeruPhilippinesPolandPortugalRomaniaRussiaSaudi ArabiaScotlandSenegalSerbiaSierra LeoneSingaporeSomaliaSouth AfricaSouth AmericaSouth Central AsiaSouth Eastern AsiaSouthern EuropeSpainSri LankaSt. Vincent and the GrenadinesSudanSwedenSwitzerlandSyriaTaiwanThailandTrinidad and TobagoTurkeyUgandaUkraineUruguayUzbekistanVenezuelaVietnamWest IndiesWestern AfricaWestern AsiaWestern EuropeYemenZaireZimbabweAzores
1st Grade
Income
Poverty
Unemployment
Labor Participation
Family Structure
Vehicle Availability
Education Level
Disability

1st Grade Comparison

Ghanaians

Immigrants from South Eastern Asia

Tragic
Tragic
97.4%
1ST GRADE
0.1/ 100
METRIC RATING
274th/ 347
METRIC RANK
97.1%
1ST GRADE
0.0/ 100
METRIC RATING
301st/ 347
METRIC RANK

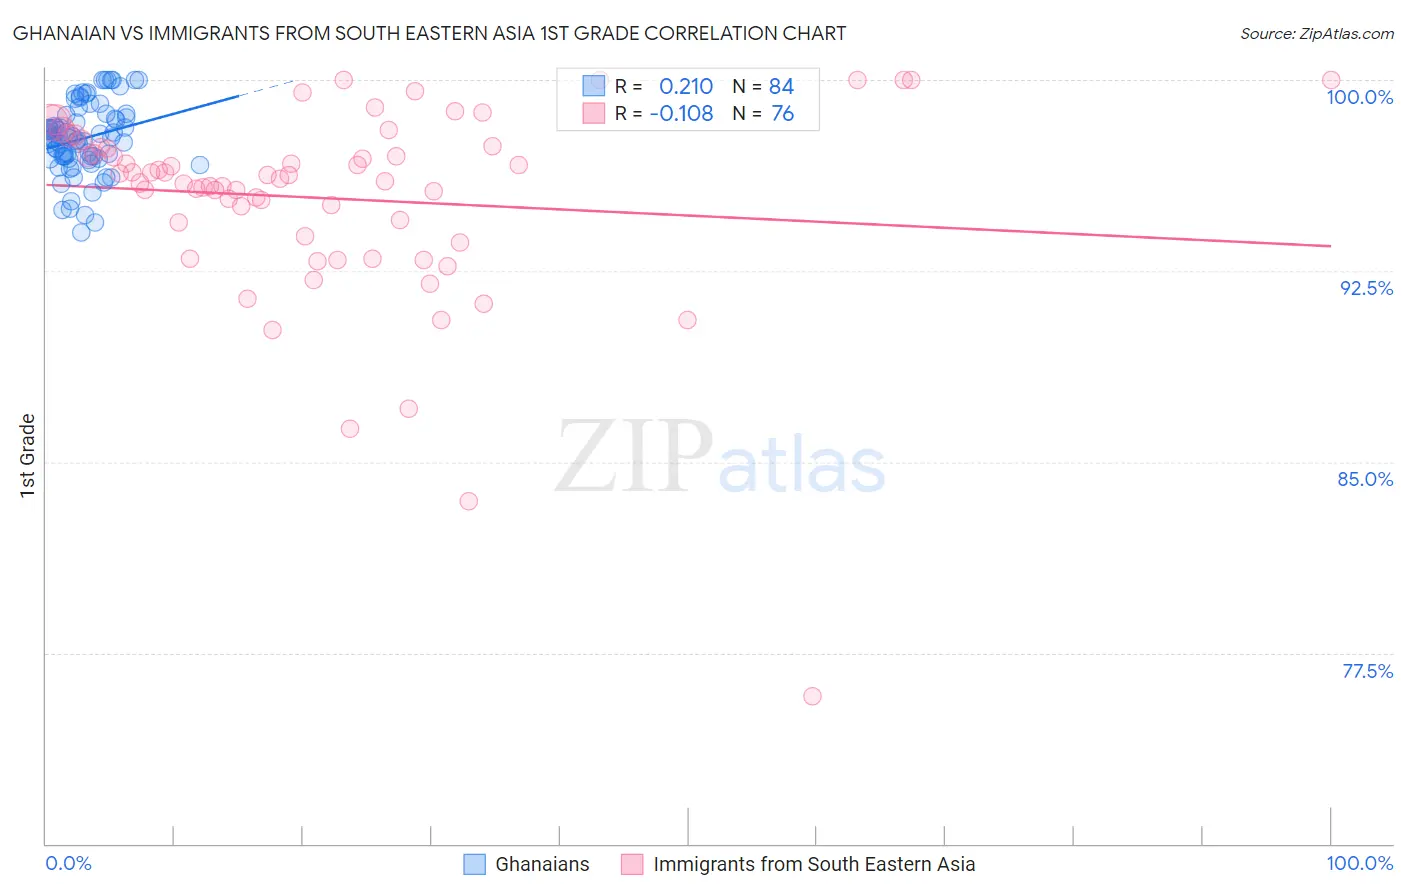
Ghanaian vs Immigrants from South Eastern Asia 1st Grade Correlation Chart

The statistical analysis conducted on geographies consisting of 190,712,873 people shows a weak positive correlation between the proportion of Ghanaians and percentage of population with at least 1st grade education in the United States with a correlation coefficient (R) of 0.210 and weighted average of 97.4%. Similarly, the statistical analysis conducted on geographies consisting of 512,710,277 people shows a poor negative correlation between the proportion of Immigrants from South Eastern Asia and percentage of population with at least 1st grade education in the United States with a correlation coefficient (R) of -0.108 and weighted average of 97.1%, a difference of 0.36%.
Ghanaian vs Immigrants from South Eastern Asia 1st Grade

1st Grade Correlation Summary

MeasurementGhanaianImmigrants from South Eastern Asia
Minimum94.0%75.8%
Maximum100.0%100.0%
Range6.0%24.2%
Mean97.7%95.4%
Median97.7%96.2%
Interquartile 25% (IQ1)97.0%94.2%
Interquartile 75% (IQ3)98.6%97.4%
Interquartile Range (IQR)1.6%3.2%
Standard Deviation (Sample)1.4%3.9%
Standard Deviation (Population)1.4%3.9%

Similar Demographics by 1st Grade

Demographics Similar to Ghanaians by 1st Grade

In terms of 1st grade, the demographic groups most similar to Ghanaians are Immigrants from China (97.4%, a difference of 0.0%), Immigrants from Philippines (97.4%, a difference of 0.020%), Immigrants from Cameroon (97.4%, a difference of 0.030%), Immigrants from Peru (97.4%, a difference of 0.030%), and Immigrants from Bolivia (97.4%, a difference of 0.030%).
DemographicsRating | Rank1st Grade
Immigrants | Sierra Leone
0.3
/100
|
#267
Tragic
97.5%
Immigrants | Nigeria
0.3
/100
|
#268
Tragic
97.5%
West Indians
0.3
/100
|
#269
Tragic
97.5%
Immigrants | Jamaica
0.2
/100
|
#270
Tragic
97.5%
Immigrants | Cameroon
0.2
/100
|
#271
Tragic
97.4%
Immigrants | Peru
0.2
/100
|
#272
Tragic
97.4%
Immigrants | Bolivia
0.2
/100
|
#273
Tragic
97.4%
Ghanaians
0.1
/100
|
#274
Tragic
97.4%
Immigrants | China
0.1
/100
|
#275
Tragic
97.4%
Immigrants | Philippines
0.1
/100
|
#276
Tragic
97.4%
Immigrants | Western Africa
0.1
/100
|
#277
Tragic
97.4%
Immigrants | Uzbekistan
0.1
/100
|
#278
Tragic
97.4%
Immigrants | Ghana
0.1
/100
|
#279
Tragic
97.4%
Afghans
0.1
/100
|
#280
Tragic
97.4%
Trinidadians and Tobagonians
0.1
/100
|
#281
Tragic
97.3%

Demographics Similar to Immigrants from South Eastern Asia by 1st Grade

In terms of 1st grade, the demographic groups most similar to Immigrants from South Eastern Asia are Immigrants from Caribbean (97.0%, a difference of 0.020%), Haitian (97.1%, a difference of 0.030%), Immigrants from Dominica (97.1%, a difference of 0.040%), Immigrants from Cuba (97.1%, a difference of 0.040%), and Somali (97.0%, a difference of 0.050%).
DemographicsRating | Rank1st Grade
Immigrants | Grenada
0.0
/100
|
#294
Tragic
97.2%
Immigrants | Immigrants
0.0
/100
|
#295
Tragic
97.2%
Immigrants | Eritrea
0.0
/100
|
#296
Tragic
97.2%
Central American Indians
0.0
/100
|
#297
Tragic
97.1%
Immigrants | Dominica
0.0
/100
|
#298
Tragic
97.1%
Immigrants | Cuba
0.0
/100
|
#299
Tragic
97.1%
Haitians
0.0
/100
|
#300
Tragic
97.1%
Immigrants | South Eastern Asia
0.0
/100
|
#301
Tragic
97.1%
Immigrants | Caribbean
0.0
/100
|
#302
Tragic
97.0%
Somalis
0.0
/100
|
#303
Tragic
97.0%
Nicaraguans
0.0
/100
|
#304
Tragic
97.0%
Ecuadorians
0.0
/100
|
#305
Tragic
97.0%
Belizeans
0.0
/100
|
#306
Tragic
96.9%
Immigrants | Somalia
0.0
/100
|
#307
Tragic
96.9%
Hispanics or Latinos
0.0
/100
|
#308
Tragic
96.9%