Ghanaian vs Immigrants from Russia Nursery School
COMPARE
Ghanaian
Immigrants from Russia
Nursery School
Nursery School Comparison
Ghanaians
Immigrants from Russia
97.5%
NURSERY SCHOOL
0.1/ 100
METRIC RATING
275th/ 347
METRIC RANK
98.0%
NURSERY SCHOOL
59.9/ 100
METRIC RATING
160th/ 347
METRIC RANK
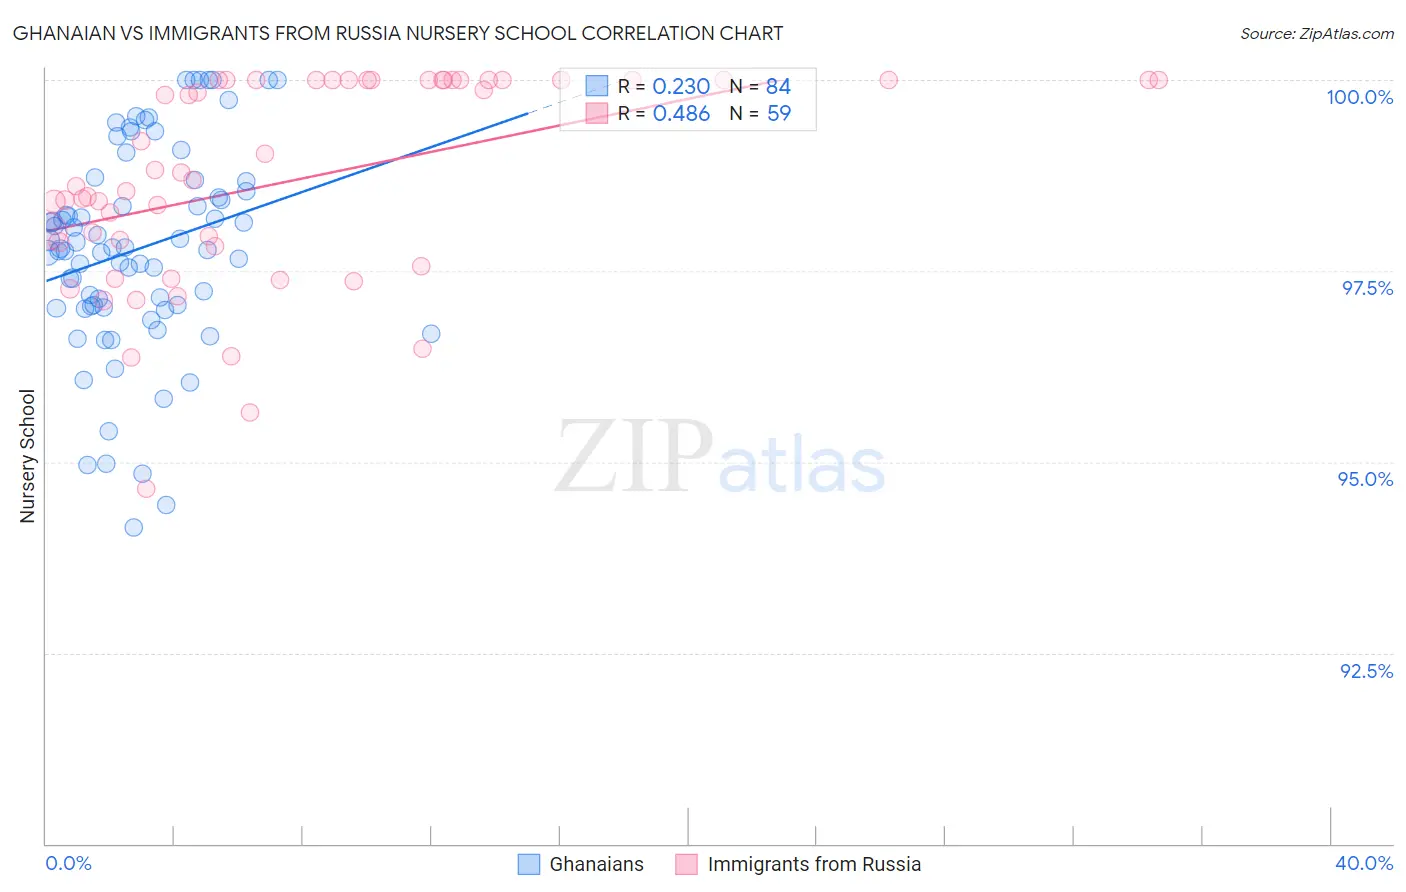
Ghanaian vs Immigrants from Russia Nursery School Correlation Chart
The statistical analysis conducted on geographies consisting of 190,712,873 people shows a weak positive correlation between the proportion of Ghanaians and percentage of population with at least nursery school education in the United States with a correlation coefficient (R) of 0.230 and weighted average of 97.5%. Similarly, the statistical analysis conducted on geographies consisting of 347,948,494 people shows a moderate positive correlation between the proportion of Immigrants from Russia and percentage of population with at least nursery school education in the United States with a correlation coefficient (R) of 0.486 and weighted average of 98.0%, a difference of 0.55%.
Nursery School Correlation Summary
| Measurement | Ghanaian | Immigrants from Russia |
| Minimum | 94.1% | 94.6% |
| Maximum | 100.0% | 100.0% |
| Range | 5.9% | 5.4% |
| Mean | 97.8% | 98.7% |
| Median | 97.8% | 98.7% |
| Interquartile 25% (IQ1) | 97.0% | 97.8% |
| Interquartile 75% (IQ3) | 98.6% | 100.0% |
| Interquartile Range (IQR) | 1.6% | 2.2% |
| Standard Deviation (Sample) | 1.3% | 1.3% |
| Standard Deviation (Population) | 1.3% | 1.3% |
Similar Demographics by Nursery School
Demographics Similar to Ghanaians by Nursery School
In terms of nursery school, the demographic groups most similar to Ghanaians are Immigrants from China (97.5%, a difference of 0.0%), Immigrants from Cameroon (97.5%, a difference of 0.0%), Immigrants from Bolivia (97.5%, a difference of 0.020%), Immigrants from Philippines (97.5%, a difference of 0.020%), and Immigrants from Western Africa (97.4%, a difference of 0.030%).
| Demographics | Rating | Rank | Nursery School |
| West Indians | 0.3 /100 | #268 | Tragic 97.5% |
| Immigrants | Liberia | 0.3 /100 | #269 | Tragic 97.5% |
| Immigrants | Jamaica | 0.2 /100 | #270 | Tragic 97.5% |
| Immigrants | Peru | 0.2 /100 | #271 | Tragic 97.5% |
| Immigrants | Bolivia | 0.1 /100 | #272 | Tragic 97.5% |
| Immigrants | China | 0.1 /100 | #273 | Tragic 97.5% |
| Immigrants | Cameroon | 0.1 /100 | #274 | Tragic 97.5% |
| Ghanaians | 0.1 /100 | #275 | Tragic 97.5% |
| Immigrants | Philippines | 0.1 /100 | #276 | Tragic 97.5% |
| Immigrants | Western Africa | 0.1 /100 | #277 | Tragic 97.4% |
| Immigrants | Uzbekistan | 0.1 /100 | #278 | Tragic 97.4% |
| Immigrants | Ghana | 0.1 /100 | #279 | Tragic 97.4% |
| Barbadians | 0.0 /100 | #280 | Tragic 97.4% |
| Trinidadians and Tobagonians | 0.0 /100 | #281 | Tragic 97.4% |
| Afghans | 0.0 /100 | #282 | Tragic 97.4% |
Demographics Similar to Immigrants from Russia by Nursery School
In terms of nursery school, the demographic groups most similar to Immigrants from Russia are Immigrants from Eastern Europe (98.0%, a difference of 0.0%), Brazilian (98.0%, a difference of 0.0%), Immigrants from Italy (98.0%, a difference of 0.0%), French American Indian (98.0%, a difference of 0.010%), and Ugandan (98.0%, a difference of 0.010%).
| Demographics | Rating | Rank | Nursery School |
| Immigrants | Moldova | 69.6 /100 | #153 | Good 98.0% |
| Immigrants | Iran | 68.7 /100 | #154 | Good 98.0% |
| Immigrants | South Central Asia | 66.7 /100 | #155 | Good 98.0% |
| Venezuelans | 66.6 /100 | #156 | Good 98.0% |
| Comanche | 66.0 /100 | #157 | Good 98.0% |
| Immigrants | North Macedonia | 65.7 /100 | #158 | Good 98.0% |
| French American Indians | 62.1 /100 | #159 | Good 98.0% |
| Immigrants | Russia | 59.9 /100 | #160 | Average 98.0% |
| Immigrants | Eastern Europe | 59.7 /100 | #161 | Average 98.0% |
| Brazilians | 59.4 /100 | #162 | Average 98.0% |
| Immigrants | Italy | 59.0 /100 | #163 | Average 98.0% |
| Ugandans | 56.4 /100 | #164 | Average 98.0% |
| Chileans | 56.4 /100 | #165 | Average 98.0% |
| Spanish Americans | 55.6 /100 | #166 | Average 98.0% |
| Immigrants | Spain | 55.6 /100 | #167 | Average 98.0% |