German vs Immigrants from Latin America College, 1 year or more
COMPARE
German
Immigrants from Latin America
College, 1 year or more
College, 1 year or more Comparison
Germans
Immigrants from Latin America
58.9%
COLLEGE, 1 YEAR OR MORE
34.7/ 100
METRIC RATING
187th/ 347
METRIC RANK
50.7%
COLLEGE, 1 YEAR OR MORE
0.0/ 100
METRIC RATING
325th/ 347
METRIC RANK
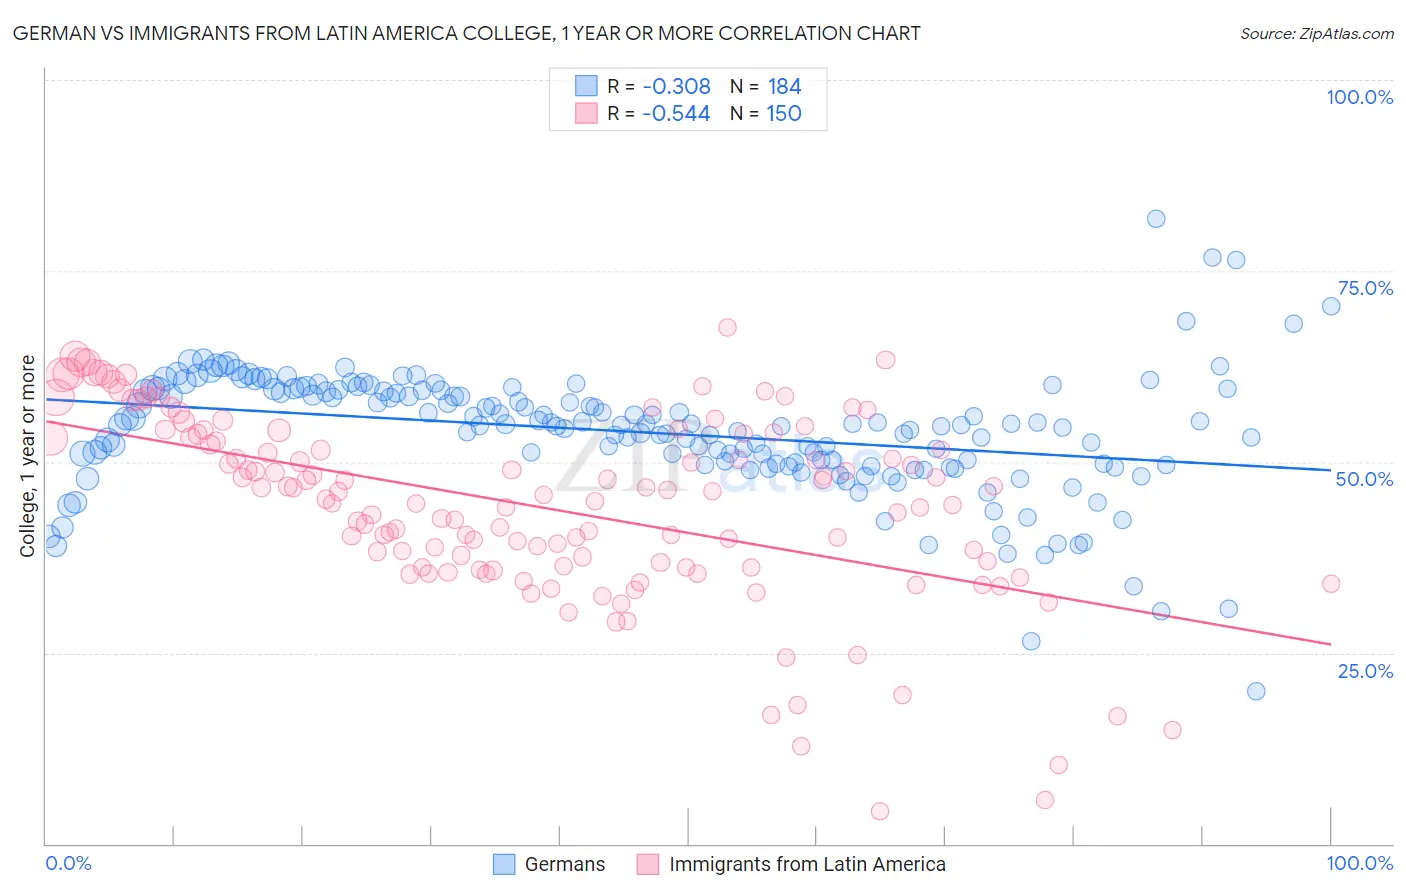
German vs Immigrants from Latin America College, 1 year or more Correlation Chart
The statistical analysis conducted on geographies consisting of 581,271,731 people shows a mild negative correlation between the proportion of Germans and percentage of population with at least college, 1 year or more education in the United States with a correlation coefficient (R) of -0.308 and weighted average of 58.9%. Similarly, the statistical analysis conducted on geographies consisting of 558,635,487 people shows a substantial negative correlation between the proportion of Immigrants from Latin America and percentage of population with at least college, 1 year or more education in the United States with a correlation coefficient (R) of -0.544 and weighted average of 50.7%, a difference of 16.3%.
College, 1 year or more Correlation Summary
| Measurement | German | Immigrants from Latin America |
| Minimum | 20.0% | 4.2% |
| Maximum | 81.8% | 67.7% |
| Range | 61.8% | 63.5% |
| Mean | 53.9% | 44.2% |
| Median | 54.9% | 45.4% |
| Interquartile 25% (IQ1) | 49.8% | 36.2% |
| Interquartile 75% (IQ3) | 59.4% | 53.6% |
| Interquartile Range (IQR) | 9.6% | 17.4% |
| Standard Deviation (Sample) | 8.2% | 12.3% |
| Standard Deviation (Population) | 8.1% | 12.2% |
Similar Demographics by College, 1 year or more
Demographics Similar to Germans by College, 1 year or more
In terms of college, 1 year or more, the demographic groups most similar to Germans are Scotch-Irish (58.9%, a difference of 0.0%), French (58.9%, a difference of 0.020%), South American (59.0%, a difference of 0.070%), Uruguayan (58.8%, a difference of 0.17%), and Spaniard (59.0%, a difference of 0.21%).
| Demographics | Rating | Rank | College, 1 year or more |
| Yugoslavians | 44.1 /100 | #180 | Average 59.2% |
| Swiss | 43.4 /100 | #181 | Average 59.2% |
| Immigrants | Bosnia and Herzegovina | 42.8 /100 | #182 | Average 59.2% |
| German Russians | 39.3 /100 | #183 | Fair 59.1% |
| Spaniards | 38.3 /100 | #184 | Fair 59.0% |
| South Americans | 35.9 /100 | #185 | Fair 59.0% |
| Scotch-Irish | 34.7 /100 | #186 | Fair 58.9% |
| Germans | 34.7 /100 | #187 | Fair 58.9% |
| French | 34.4 /100 | #188 | Fair 58.9% |
| Uruguayans | 31.8 /100 | #189 | Fair 58.8% |
| Immigrants | Cameroon | 31.2 /100 | #190 | Fair 58.8% |
| Immigrants | Philippines | 29.2 /100 | #191 | Fair 58.7% |
| Colombians | 27.6 /100 | #192 | Fair 58.7% |
| Peruvians | 27.5 /100 | #193 | Fair 58.6% |
| Costa Ricans | 26.4 /100 | #194 | Fair 58.6% |
Demographics Similar to Immigrants from Latin America by College, 1 year or more
In terms of college, 1 year or more, the demographic groups most similar to Immigrants from Latin America are Immigrants from Cuba (50.7%, a difference of 0.030%), Immigrants from Guatemala (50.7%, a difference of 0.040%), Dominican (50.6%, a difference of 0.18%), Menominee (50.6%, a difference of 0.22%), and Navajo (50.8%, a difference of 0.27%).
| Demographics | Rating | Rank | College, 1 year or more |
| Immigrants | Honduras | 0.0 /100 | #318 | Tragic 51.0% |
| Immigrants | El Salvador | 0.0 /100 | #319 | Tragic 51.0% |
| Kiowa | 0.0 /100 | #320 | Tragic 51.0% |
| Hopi | 0.0 /100 | #321 | Tragic 50.9% |
| Navajo | 0.0 /100 | #322 | Tragic 50.8% |
| Immigrants | Guatemala | 0.0 /100 | #323 | Tragic 50.7% |
| Immigrants | Cuba | 0.0 /100 | #324 | Tragic 50.7% |
| Immigrants | Latin America | 0.0 /100 | #325 | Tragic 50.7% |
| Dominicans | 0.0 /100 | #326 | Tragic 50.6% |
| Menominee | 0.0 /100 | #327 | Tragic 50.6% |
| Dutch West Indians | 0.0 /100 | #328 | Tragic 50.5% |
| Cape Verdeans | 0.0 /100 | #329 | Tragic 50.3% |
| Natives/Alaskans | 0.0 /100 | #330 | Tragic 50.2% |
| Immigrants | Yemen | 0.0 /100 | #331 | Tragic 50.0% |
| Mexicans | 0.0 /100 | #332 | Tragic 49.2% |