German Russian vs Yuman Associate's Degree
COMPARE
German Russian
Yuman
Associate's Degree
Associate's Degree Comparison
German Russians
Yuman
45.1%
ASSOCIATE'S DEGREE
18.9/ 100
METRIC RATING
206th/ 347
METRIC RANK
31.3%
ASSOCIATE'S DEGREE
0.0/ 100
METRIC RATING
344th/ 347
METRIC RANK
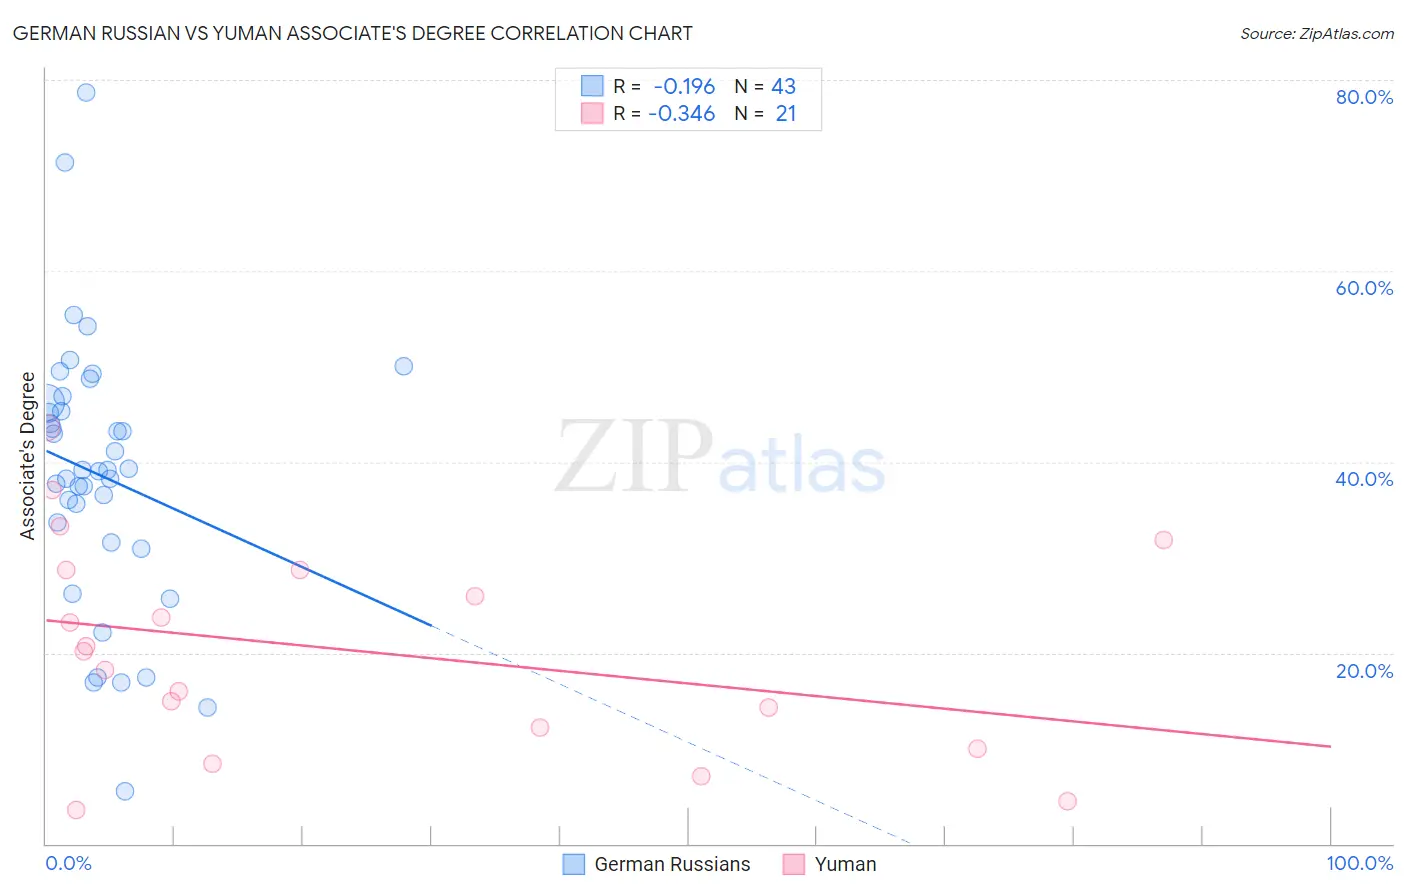
German Russian vs Yuman Associate's Degree Correlation Chart
The statistical analysis conducted on geographies consisting of 96,460,905 people shows a poor negative correlation between the proportion of German Russians and percentage of population with at least associate's degree education in the United States with a correlation coefficient (R) of -0.196 and weighted average of 45.1%. Similarly, the statistical analysis conducted on geographies consisting of 40,695,957 people shows a mild negative correlation between the proportion of Yuman and percentage of population with at least associate's degree education in the United States with a correlation coefficient (R) of -0.346 and weighted average of 31.3%, a difference of 44.3%.
Associate's Degree Correlation Summary
| Measurement | German Russian | Yuman |
| Minimum | 5.6% | 3.5% |
| Maximum | 78.7% | 43.6% |
| Range | 73.1% | 40.1% |
| Mean | 38.6% | 20.3% |
| Median | 39.1% | 20.2% |
| Interquartile 25% (IQ1) | 31.5% | 11.1% |
| Interquartile 75% (IQ3) | 46.2% | 28.7% |
| Interquartile Range (IQR) | 14.6% | 17.6% |
| Standard Deviation (Sample) | 14.2% | 11.0% |
| Standard Deviation (Population) | 14.0% | 10.8% |
Similar Demographics by Associate's Degree
Demographics Similar to German Russians by Associate's Degree
In terms of associate's degree, the demographic groups most similar to German Russians are Immigrants from Thailand (45.1%, a difference of 0.0%), Nigerian (45.1%, a difference of 0.030%), Panamanian (45.1%, a difference of 0.070%), Immigrants from South Eastern Asia (45.2%, a difference of 0.17%), and Dutch (45.0%, a difference of 0.17%).
| Demographics | Rating | Rank | Associate's Degree |
| Immigrants | Senegal | 21.2 /100 | #199 | Fair 45.2% |
| Senegalese | 21.1 /100 | #200 | Fair 45.2% |
| Immigrants | Vietnam | 20.8 /100 | #201 | Fair 45.2% |
| Spaniards | 20.4 /100 | #202 | Fair 45.2% |
| Immigrants | South Eastern Asia | 20.2 /100 | #203 | Fair 45.2% |
| Nigerians | 19.1 /100 | #204 | Poor 45.1% |
| Immigrants | Thailand | 18.9 /100 | #205 | Poor 45.1% |
| German Russians | 18.9 /100 | #206 | Poor 45.1% |
| Panamanians | 18.4 /100 | #207 | Poor 45.1% |
| Dutch | 17.6 /100 | #208 | Poor 45.0% |
| Immigrants | Costa Rica | 16.7 /100 | #209 | Poor 45.0% |
| Immigrants | Philippines | 16.7 /100 | #210 | Poor 45.0% |
| Immigrants | Zaire | 16.6 /100 | #211 | Poor 45.0% |
| French Canadians | 15.0 /100 | #212 | Poor 44.9% |
| Immigrants | Ghana | 14.2 /100 | #213 | Poor 44.8% |
Demographics Similar to Yuman by Associate's Degree
In terms of associate's degree, the demographic groups most similar to Yuman are Tohono O'odham (31.8%, a difference of 1.7%), Yakama (32.3%, a difference of 3.4%), Pima (30.2%, a difference of 3.4%), Inupiat (32.6%, a difference of 4.2%), and Navajo (32.6%, a difference of 4.3%).
| Demographics | Rating | Rank | Associate's Degree |
| Mexicans | 0.0 /100 | #333 | Tragic 35.0% |
| Natives/Alaskans | 0.0 /100 | #334 | Tragic 34.9% |
| Spanish American Indians | 0.0 /100 | #335 | Tragic 34.9% |
| Hopi | 0.0 /100 | #336 | Tragic 34.6% |
| Lumbee | 0.0 /100 | #337 | Tragic 34.1% |
| Pueblo | 0.0 /100 | #338 | Tragic 34.0% |
| Immigrants | Mexico | 0.0 /100 | #339 | Tragic 33.7% |
| Navajo | 0.0 /100 | #340 | Tragic 32.6% |
| Inupiat | 0.0 /100 | #341 | Tragic 32.6% |
| Yakama | 0.0 /100 | #342 | Tragic 32.3% |
| Tohono O'odham | 0.0 /100 | #343 | Tragic 31.8% |
| Yuman | 0.0 /100 | #344 | Tragic 31.3% |
| Pima | 0.0 /100 | #345 | Tragic 30.2% |
| Houma | 0.0 /100 | #346 | Tragic 28.2% |
| Yup'ik | 0.0 /100 | #347 | Tragic 25.0% |