German Russian vs Immigrants from Moldova No Schooling Completed
COMPARE
German Russian
Immigrants from Moldova
No Schooling Completed
No Schooling Completed Comparison
German Russians
Immigrants from Moldova
1.8%
NO SCHOOLING COMPLETED
97.5/ 100
METRIC RATING
105th/ 347
METRIC RANK
2.0%
NO SCHOOLING COMPLETED
78.0/ 100
METRIC RATING
146th/ 347
METRIC RANK
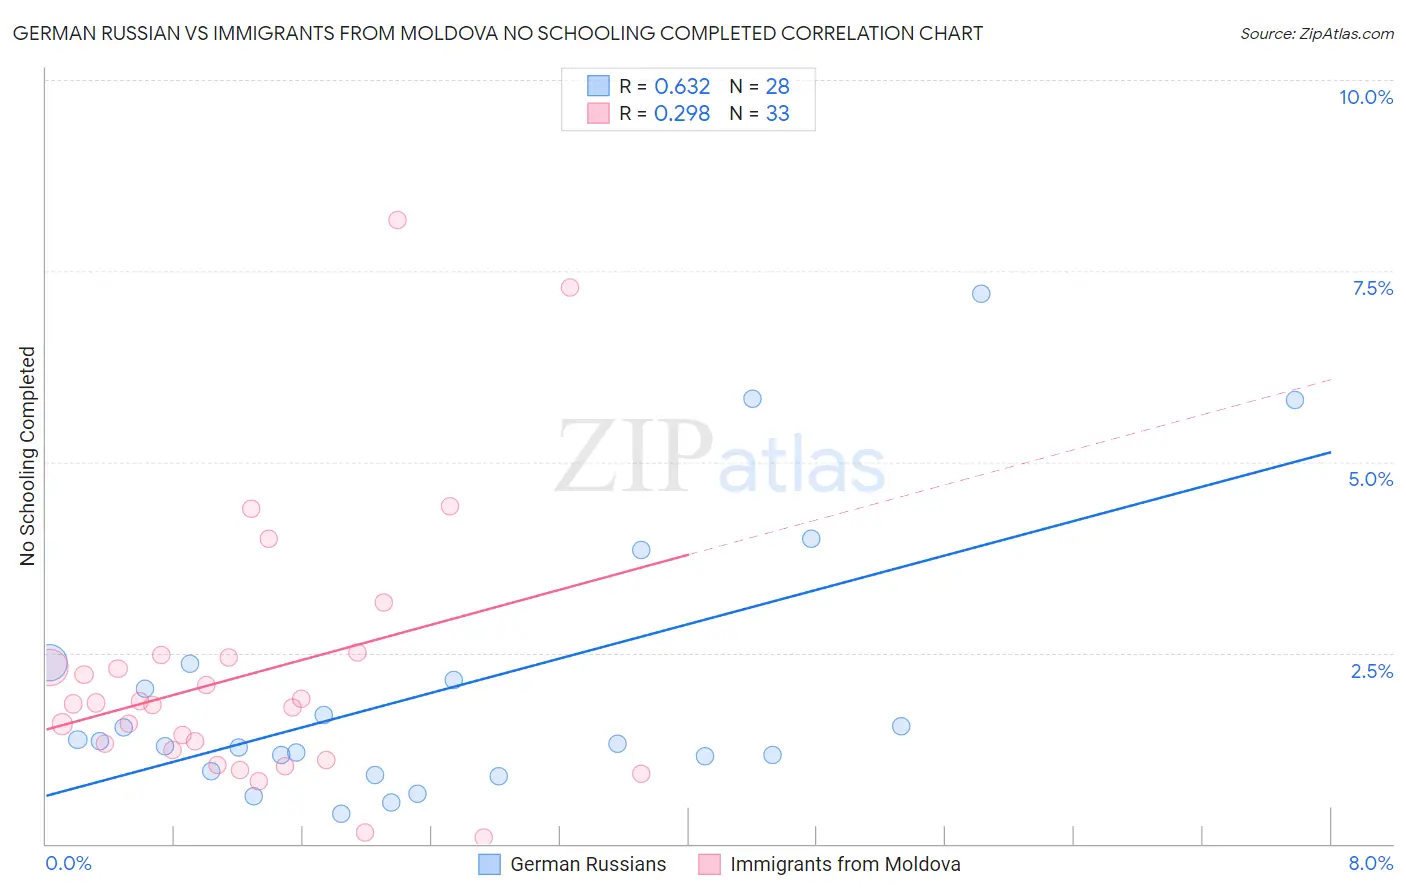
German Russian vs Immigrants from Moldova No Schooling Completed Correlation Chart
The statistical analysis conducted on geographies consisting of 96,119,740 people shows a significant positive correlation between the proportion of German Russians and percentage of population with no schooling in the United States with a correlation coefficient (R) of 0.632 and weighted average of 1.8%. Similarly, the statistical analysis conducted on geographies consisting of 123,856,297 people shows a weak positive correlation between the proportion of Immigrants from Moldova and percentage of population with no schooling in the United States with a correlation coefficient (R) of 0.298 and weighted average of 2.0%, a difference of 9.2%.
No Schooling Completed Correlation Summary
| Measurement | German Russian | Immigrants from Moldova |
| Minimum | 0.39% | 0.082% |
| Maximum | 7.2% | 8.2% |
| Range | 6.8% | 8.1% |
| Mean | 2.0% | 2.2% |
| Median | 1.3% | 1.8% |
| Interquartile 25% (IQ1) | 1.0% | 1.2% |
| Interquartile 75% (IQ3) | 2.3% | 2.5% |
| Interquartile Range (IQR) | 1.2% | 1.3% |
| Standard Deviation (Sample) | 1.7% | 1.8% |
| Standard Deviation (Population) | 1.7% | 1.7% |
Similar Demographics by No Schooling Completed
Demographics Similar to German Russians by No Schooling Completed
In terms of no schooling completed, the demographic groups most similar to German Russians are Thai (1.8%, a difference of 0.020%), Immigrants from France (1.8%, a difference of 0.40%), Yugoslavian (1.8%, a difference of 0.44%), Basque (1.8%, a difference of 0.60%), and Immigrants from Switzerland (1.8%, a difference of 0.65%).
| Demographics | Rating | Rank | No Schooling Completed |
| Iranians | 98.2 /100 | #98 | Exceptional 1.8% |
| Choctaw | 98.1 /100 | #99 | Exceptional 1.8% |
| Immigrants | Singapore | 98.0 /100 | #100 | Exceptional 1.8% |
| Immigrants | Czechoslovakia | 97.9 /100 | #101 | Exceptional 1.8% |
| Immigrants | Switzerland | 97.9 /100 | #102 | Exceptional 1.8% |
| Basques | 97.9 /100 | #103 | Exceptional 1.8% |
| Thais | 97.5 /100 | #104 | Exceptional 1.8% |
| German Russians | 97.5 /100 | #105 | Exceptional 1.8% |
| Immigrants | France | 97.3 /100 | #106 | Exceptional 1.8% |
| Yugoslavians | 97.2 /100 | #107 | Exceptional 1.8% |
| Okinawans | 97.1 /100 | #108 | Exceptional 1.8% |
| Immigrants | Saudi Arabia | 96.8 /100 | #109 | Exceptional 1.9% |
| Immigrants | Latvia | 96.7 /100 | #110 | Exceptional 1.9% |
| Immigrants | Japan | 96.6 /100 | #111 | Exceptional 1.9% |
| Pueblo | 96.4 /100 | #112 | Exceptional 1.9% |
Demographics Similar to Immigrants from Moldova by No Schooling Completed
In terms of no schooling completed, the demographic groups most similar to Immigrants from Moldova are Soviet Union (2.0%, a difference of 0.17%), Immigrants from Iran (2.0%, a difference of 0.21%), Alsatian (2.0%, a difference of 0.22%), Shoshone (2.0%, a difference of 0.26%), and Immigrants from North Macedonia (2.0%, a difference of 0.41%).
| Demographics | Rating | Rank | No Schooling Completed |
| Jordanians | 84.5 /100 | #139 | Excellent 2.0% |
| Marshallese | 83.5 /100 | #140 | Excellent 2.0% |
| Immigrants | Greece | 83.5 /100 | #141 | Excellent 2.0% |
| Venezuelans | 81.5 /100 | #142 | Excellent 2.0% |
| Immigrants | South Central Asia | 80.0 /100 | #143 | Good 2.0% |
| Alsatians | 79.1 /100 | #144 | Good 2.0% |
| Immigrants | Iran | 79.0 /100 | #145 | Good 2.0% |
| Immigrants | Moldova | 78.0 /100 | #146 | Good 2.0% |
| Soviet Union | 77.1 /100 | #147 | Good 2.0% |
| Shoshone | 76.7 /100 | #148 | Good 2.0% |
| Immigrants | North Macedonia | 75.9 /100 | #149 | Good 2.0% |
| Blackfeet | 72.9 /100 | #150 | Good 2.0% |
| Immigrants | Jordan | 70.9 /100 | #151 | Good 2.0% |
| Immigrants | Eastern Europe | 70.4 /100 | #152 | Good 2.0% |
| Immigrants | Italy | 68.9 /100 | #153 | Good 2.0% |