German Russian vs Immigrants from Lithuania Professional Degree
COMPARE
German Russian
Immigrants from Lithuania
Professional Degree
Professional Degree Comparison
German Russians
Immigrants from Lithuania
4.0%
PROFESSIONAL DEGREE
6.1/ 100
METRIC RATING
226th/ 347
METRIC RANK
5.6%
PROFESSIONAL DEGREE
99.9/ 100
METRIC RATING
61st/ 347
METRIC RANK
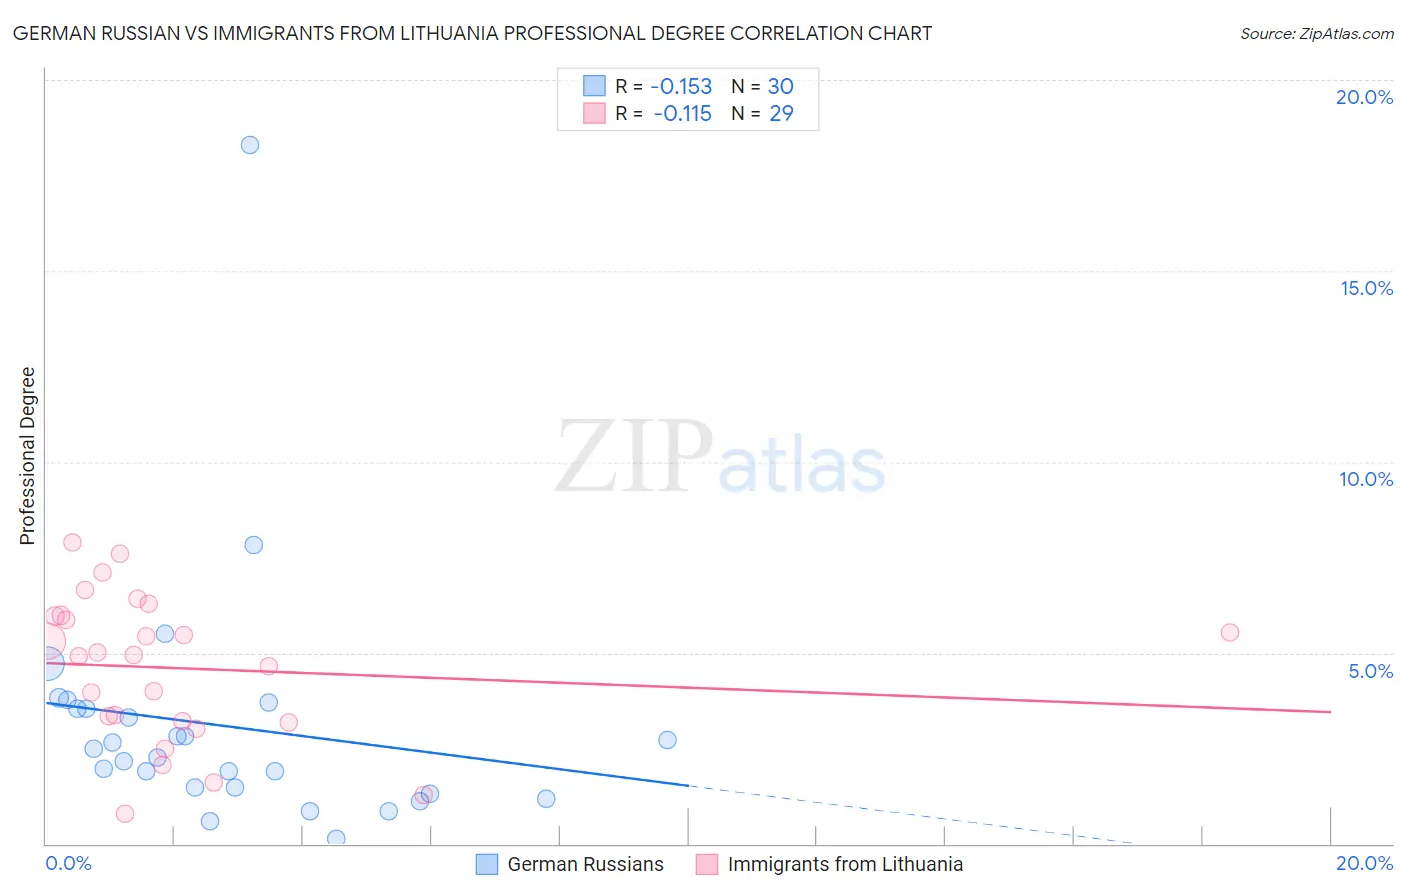
German Russian vs Immigrants from Lithuania Professional Degree Correlation Chart
The statistical analysis conducted on geographies consisting of 96,360,992 people shows a poor negative correlation between the proportion of German Russians and percentage of population with at least professional degree education in the United States with a correlation coefficient (R) of -0.153 and weighted average of 4.0%. Similarly, the statistical analysis conducted on geographies consisting of 117,699,727 people shows a poor negative correlation between the proportion of Immigrants from Lithuania and percentage of population with at least professional degree education in the United States with a correlation coefficient (R) of -0.115 and weighted average of 5.6%, a difference of 40.5%.
Professional Degree Correlation Summary
| Measurement | German Russian | Immigrants from Lithuania |
| Minimum | 0.15% | 0.77% |
| Maximum | 18.3% | 7.9% |
| Range | 18.2% | 7.1% |
| Mean | 3.1% | 4.6% |
| Median | 2.4% | 4.9% |
| Interquartile 25% (IQ1) | 1.5% | 3.2% |
| Interquartile 75% (IQ3) | 3.6% | 6.0% |
| Interquartile Range (IQR) | 2.1% | 2.8% |
| Standard Deviation (Sample) | 3.3% | 1.9% |
| Standard Deviation (Population) | 3.2% | 1.9% |
Similar Demographics by Professional Degree
Demographics Similar to German Russians by Professional Degree
In terms of professional degree, the demographic groups most similar to German Russians are Cuban (4.0%, a difference of 0.12%), Immigrants from West Indies (4.0%, a difference of 0.37%), Immigrants from Burma/Myanmar (3.9%, a difference of 0.52%), Tlingit-Haida (4.0%, a difference of 0.55%), and Trinidadian and Tobagonian (4.0%, a difference of 0.68%).
| Demographics | Rating | Rank | Professional Degree |
| Immigrants | South Eastern Asia | 8.9 /100 | #219 | Tragic 4.0% |
| Ute | 8.2 /100 | #220 | Tragic 4.0% |
| French Canadians | 8.0 /100 | #221 | Tragic 4.0% |
| Immigrants | Western Africa | 7.5 /100 | #222 | Tragic 4.0% |
| Immigrants | Bosnia and Herzegovina | 7.4 /100 | #223 | Tragic 4.0% |
| Trinidadians and Tobagonians | 7.1 /100 | #224 | Tragic 4.0% |
| Tlingit-Haida | 6.9 /100 | #225 | Tragic 4.0% |
| German Russians | 6.1 /100 | #226 | Tragic 4.0% |
| Cubans | 5.9 /100 | #227 | Tragic 4.0% |
| Immigrants | West Indies | 5.6 /100 | #228 | Tragic 4.0% |
| Immigrants | Burma/Myanmar | 5.4 /100 | #229 | Tragic 3.9% |
| Nicaraguans | 5.1 /100 | #230 | Tragic 3.9% |
| Ecuadorians | 4.6 /100 | #231 | Tragic 3.9% |
| Cree | 4.3 /100 | #232 | Tragic 3.9% |
| Immigrants | Philippines | 4.1 /100 | #233 | Tragic 3.9% |
Demographics Similar to Immigrants from Lithuania by Professional Degree
In terms of professional degree, the demographic groups most similar to Immigrants from Lithuania are Bolivian (5.6%, a difference of 0.65%), Immigrants from Belarus (5.5%, a difference of 0.76%), Immigrants from Europe (5.6%, a difference of 1.1%), Asian (5.5%, a difference of 1.2%), and Immigrants from Asia (5.5%, a difference of 1.3%).
| Demographics | Rating | Rank | Professional Degree |
| Immigrants | Kuwait | 100.0 /100 | #54 | Exceptional 5.7% |
| Immigrants | Western Europe | 100.0 /100 | #55 | Exceptional 5.7% |
| Immigrants | Malaysia | 100.0 /100 | #56 | Exceptional 5.7% |
| South Africans | 100.0 /100 | #57 | Exceptional 5.7% |
| Bulgarians | 100.0 /100 | #58 | Exceptional 5.7% |
| Immigrants | Europe | 100.0 /100 | #59 | Exceptional 5.6% |
| Bolivians | 99.9 /100 | #60 | Exceptional 5.6% |
| Immigrants | Lithuania | 99.9 /100 | #61 | Exceptional 5.6% |
| Immigrants | Belarus | 99.9 /100 | #62 | Exceptional 5.5% |
| Asians | 99.9 /100 | #63 | Exceptional 5.5% |
| Immigrants | Asia | 99.9 /100 | #64 | Exceptional 5.5% |
| Immigrants | Bolivia | 99.9 /100 | #65 | Exceptional 5.5% |
| Immigrants | Kazakhstan | 99.9 /100 | #66 | Exceptional 5.5% |
| Immigrants | Bulgaria | 99.9 /100 | #67 | Exceptional 5.5% |
| Immigrants | Lebanon | 99.9 /100 | #68 | Exceptional 5.5% |