German Russian vs Argentinean 12th Grade, No Diploma
COMPARE
German Russian
Argentinean
12th Grade, No Diploma
12th Grade, No Diploma Comparison
German Russians
Argentineans
91.8%
12TH GRADE, NO DIPLOMA
89.8/ 100
METRIC RATING
129th/ 347
METRIC RANK
91.6%
12TH GRADE, NO DIPLOMA
82.0/ 100
METRIC RATING
141st/ 347
METRIC RANK
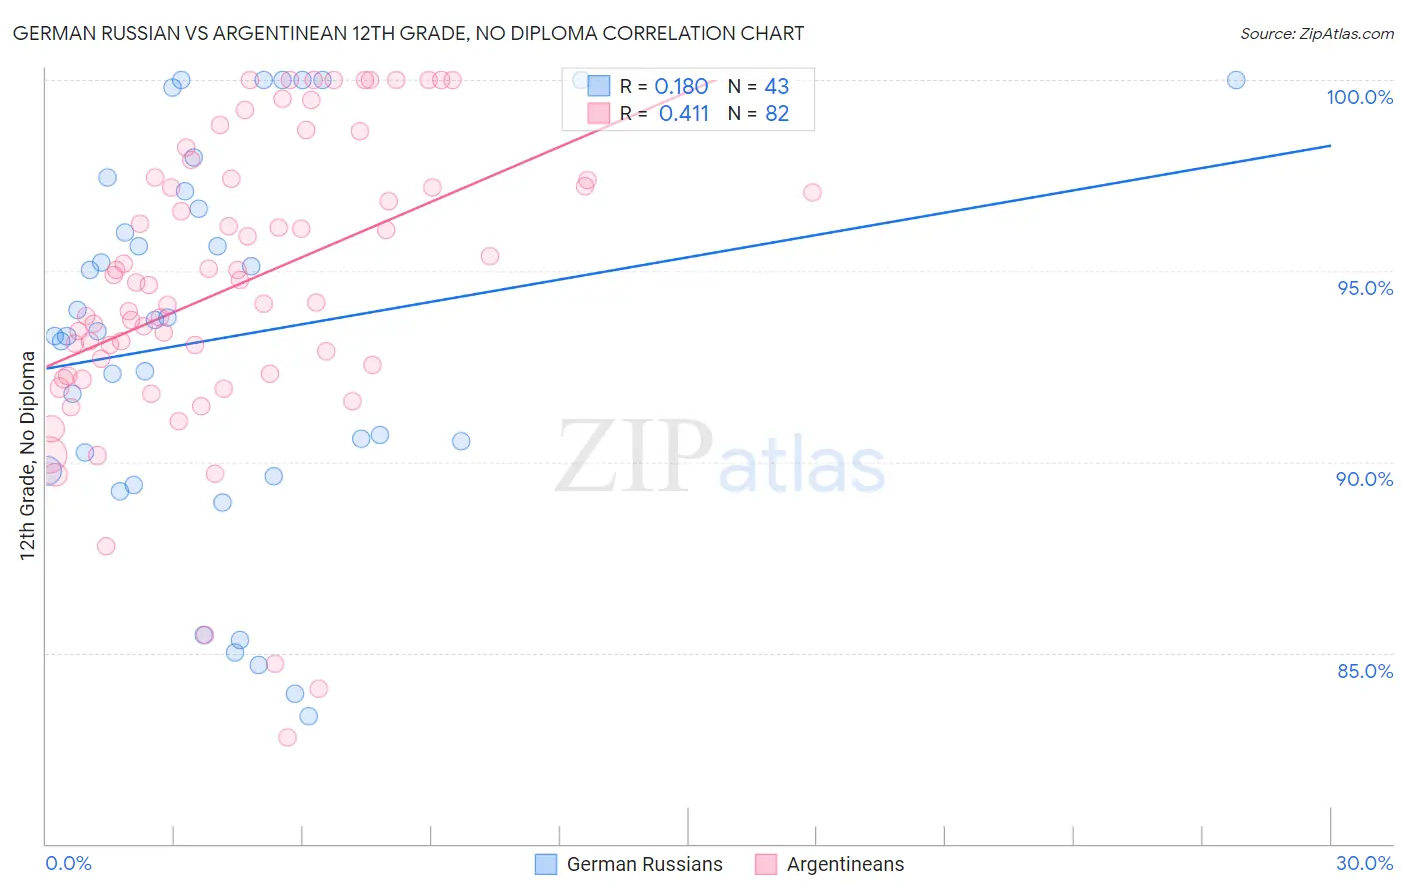
German Russian vs Argentinean 12th Grade, No Diploma Correlation Chart
The statistical analysis conducted on geographies consisting of 96,461,984 people shows a poor positive correlation between the proportion of German Russians and percentage of population with at least 12th grade (no diploma) education in the United States with a correlation coefficient (R) of 0.180 and weighted average of 91.8%. Similarly, the statistical analysis conducted on geographies consisting of 297,143,432 people shows a moderate positive correlation between the proportion of Argentineans and percentage of population with at least 12th grade (no diploma) education in the United States with a correlation coefficient (R) of 0.411 and weighted average of 91.6%, a difference of 0.20%.
12th Grade, No Diploma Correlation Summary
| Measurement | German Russian | Argentinean |
| Minimum | 83.3% | 82.8% |
| Maximum | 100.0% | 100.0% |
| Range | 16.7% | 17.2% |
| Mean | 93.2% | 94.6% |
| Median | 93.4% | 94.7% |
| Interquartile 25% (IQ1) | 89.8% | 92.3% |
| Interquartile 75% (IQ3) | 97.1% | 97.4% |
| Interquartile Range (IQR) | 7.3% | 5.1% |
| Standard Deviation (Sample) | 4.9% | 3.9% |
| Standard Deviation (Population) | 4.9% | 3.8% |
Demographics Similar to German Russians and Argentineans by 12th Grade, No Diploma
In terms of 12th grade, no diploma, the demographic groups most similar to German Russians are Assyrian/Chaldean/Syriac (91.8%, a difference of 0.0%), Mongolian (91.8%, a difference of 0.010%), Albanian (91.8%, a difference of 0.010%), Immigrants from Eastern Asia (91.8%, a difference of 0.020%), and Immigrants from Jordan (91.8%, a difference of 0.040%). Similarly, the demographic groups most similar to Argentineans are Immigrants from Poland (91.6%, a difference of 0.010%), Immigrants from Venezuela (91.6%, a difference of 0.020%), Immigrants from Argentina (91.6%, a difference of 0.030%), Immigrants from Egypt (91.6%, a difference of 0.040%), and Immigrants from Spain (91.6%, a difference of 0.040%).
| Demographics | Rating | Rank | 12th Grade, No Diploma |
| Whites/Caucasians | 91.6 /100 | #125 | Exceptional 91.8% |
| Basques | 91.3 /100 | #126 | Exceptional 91.8% |
| Immigrants | Jordan | 91.0 /100 | #127 | Exceptional 91.8% |
| Mongolians | 89.9 /100 | #128 | Excellent 91.8% |
| German Russians | 89.8 /100 | #129 | Excellent 91.8% |
| Assyrians/Chaldeans/Syriacs | 89.6 /100 | #130 | Excellent 91.8% |
| Albanians | 89.3 /100 | #131 | Excellent 91.8% |
| Immigrants | Eastern Asia | 89.3 /100 | #132 | Excellent 91.8% |
| Immigrants | Italy | 88.3 /100 | #133 | Excellent 91.7% |
| Venezuelans | 88.2 /100 | #134 | Excellent 91.7% |
| Immigrants | Bosnia and Herzegovina | 87.3 /100 | #135 | Excellent 91.7% |
| Chileans | 85.8 /100 | #136 | Excellent 91.7% |
| Alaska Natives | 84.9 /100 | #137 | Excellent 91.6% |
| Arabs | 84.1 /100 | #138 | Excellent 91.6% |
| Immigrants | Egypt | 83.9 /100 | #139 | Excellent 91.6% |
| Immigrants | Poland | 82.3 /100 | #140 | Excellent 91.6% |
| Argentineans | 82.0 /100 | #141 | Excellent 91.6% |
| Immigrants | Venezuela | 80.9 /100 | #142 | Excellent 91.6% |
| Immigrants | Argentina | 80.7 /100 | #143 | Excellent 91.6% |
| Immigrants | Spain | 80.1 /100 | #144 | Excellent 91.6% |
| Immigrants | Lebanon | 80.0 /100 | #145 | Excellent 91.6% |