French vs Serbian Associate's Degree
COMPARE
French
Serbian
Associate's Degree
Associate's Degree Comparison
French
Serbians
45.4%
ASSOCIATE'S DEGREE
25.6/ 100
METRIC RATING
196th/ 347
METRIC RANK
48.5%
ASSOCIATE'S DEGREE
92.6/ 100
METRIC RATING
124th/ 347
METRIC RANK
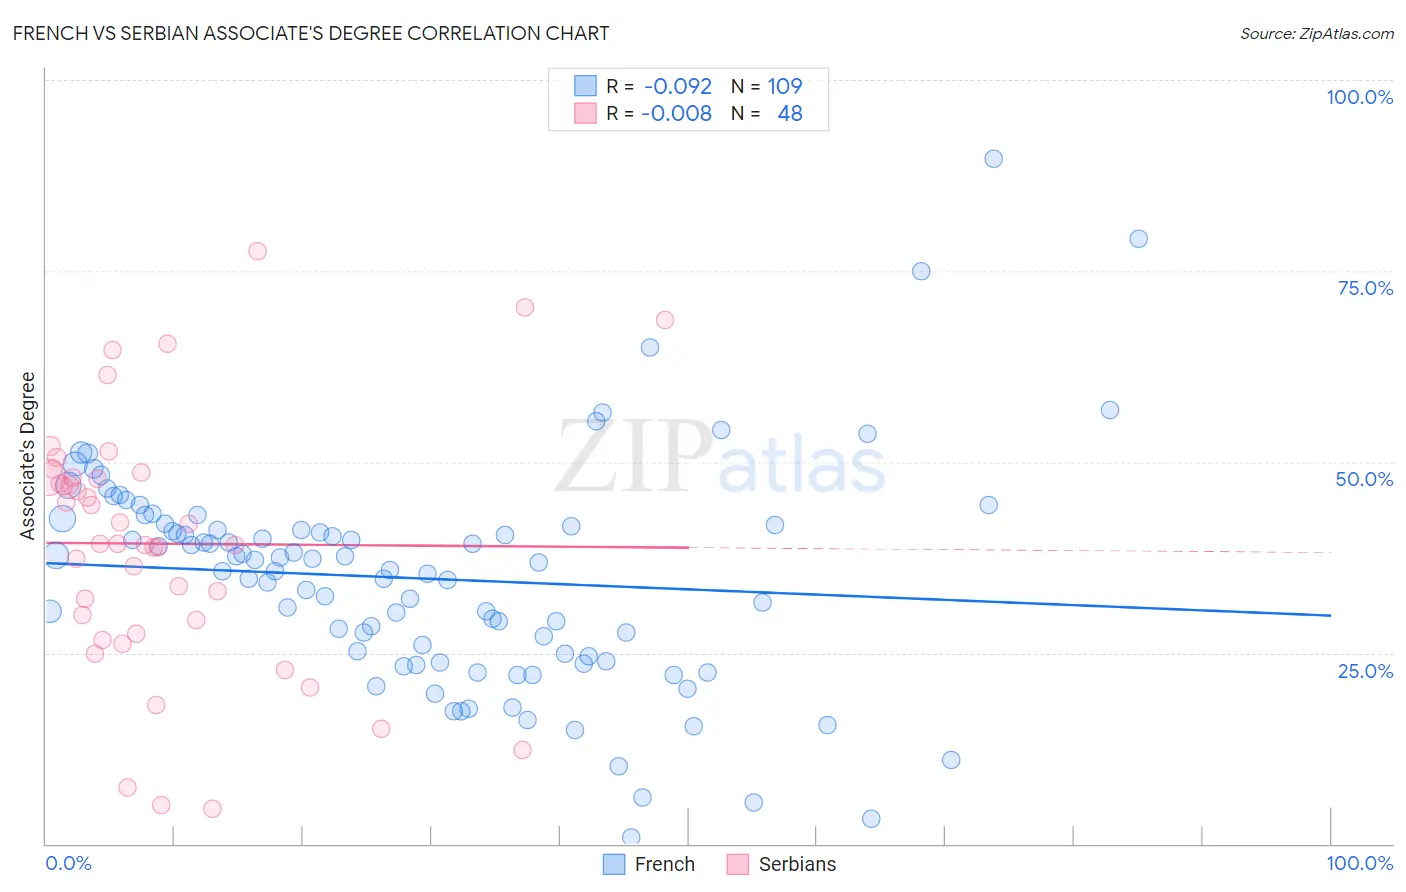
French vs Serbian Associate's Degree Correlation Chart
The statistical analysis conducted on geographies consisting of 572,343,340 people shows a slight negative correlation between the proportion of French and percentage of population with at least associate's degree education in the United States with a correlation coefficient (R) of -0.092 and weighted average of 45.4%. Similarly, the statistical analysis conducted on geographies consisting of 267,638,366 people shows no correlation between the proportion of Serbians and percentage of population with at least associate's degree education in the United States with a correlation coefficient (R) of -0.008 and weighted average of 48.5%, a difference of 6.9%.
Associate's Degree Correlation Summary
| Measurement | French | Serbian |
| Minimum | 0.78% | 4.6% |
| Maximum | 89.7% | 77.6% |
| Range | 88.9% | 73.0% |
| Mean | 34.7% | 39.3% |
| Median | 35.9% | 39.3% |
| Interquartile 25% (IQ1) | 24.2% | 28.5% |
| Interquartile 75% (IQ3) | 41.7% | 47.9% |
| Interquartile Range (IQR) | 17.5% | 19.5% |
| Standard Deviation (Sample) | 14.6% | 16.7% |
| Standard Deviation (Population) | 14.6% | 16.5% |
Similar Demographics by Associate's Degree
Demographics Similar to French by Associate's Degree
In terms of associate's degree, the demographic groups most similar to French are German (45.5%, a difference of 0.090%), Immigrants from Peru (45.5%, a difference of 0.19%), Scotch-Irish (45.3%, a difference of 0.35%), Immigrants from Bangladesh (45.2%, a difference of 0.45%), and Immigrants from Senegal (45.2%, a difference of 0.47%).
| Demographics | Rating | Rank | Associate's Degree |
| Immigrants | Oceania | 34.7 /100 | #189 | Fair 45.8% |
| Vietnamese | 34.0 /100 | #190 | Fair 45.8% |
| Koreans | 33.8 /100 | #191 | Fair 45.8% |
| Celtics | 33.3 /100 | #192 | Fair 45.8% |
| Immigrants | Cameroon | 31.0 /100 | #193 | Fair 45.7% |
| Immigrants | Peru | 27.6 /100 | #194 | Fair 45.5% |
| Germans | 26.5 /100 | #195 | Fair 45.5% |
| French | 25.6 /100 | #196 | Fair 45.4% |
| Scotch-Irish | 22.3 /100 | #197 | Fair 45.3% |
| Immigrants | Bangladesh | 21.3 /100 | #198 | Fair 45.2% |
| Immigrants | Senegal | 21.2 /100 | #199 | Fair 45.2% |
| Senegalese | 21.1 /100 | #200 | Fair 45.2% |
| Immigrants | Vietnam | 20.8 /100 | #201 | Fair 45.2% |
| Spaniards | 20.4 /100 | #202 | Fair 45.2% |
| Immigrants | South Eastern Asia | 20.2 /100 | #203 | Fair 45.2% |
Demographics Similar to Serbians by Associate's Degree
In terms of associate's degree, the demographic groups most similar to Serbians are Chinese (48.5%, a difference of 0.020%), Immigrants from Syria (48.5%, a difference of 0.10%), Immigrants from Uganda (48.5%, a difference of 0.12%), Immigrants from Eastern Africa (48.4%, a difference of 0.23%), and Swedish (48.4%, a difference of 0.27%).
| Demographics | Rating | Rank | Associate's Degree |
| Afghans | 94.8 /100 | #117 | Exceptional 48.9% |
| Albanians | 94.7 /100 | #118 | Exceptional 48.8% |
| Lebanese | 94.6 /100 | #119 | Exceptional 48.8% |
| Alsatians | 94.6 /100 | #120 | Exceptional 48.8% |
| Ugandans | 93.9 /100 | #121 | Exceptional 48.7% |
| Italians | 93.9 /100 | #122 | Exceptional 48.7% |
| Brazilians | 93.7 /100 | #123 | Exceptional 48.7% |
| Serbians | 92.6 /100 | #124 | Exceptional 48.5% |
| Chinese | 92.5 /100 | #125 | Exceptional 48.5% |
| Immigrants | Syria | 92.2 /100 | #126 | Exceptional 48.5% |
| Immigrants | Uganda | 92.1 /100 | #127 | Exceptional 48.5% |
| Immigrants | Eastern Africa | 91.6 /100 | #128 | Exceptional 48.4% |
| Swedes | 91.5 /100 | #129 | Exceptional 48.4% |
| Immigrants | Jordan | 91.2 /100 | #130 | Exceptional 48.4% |
| Icelanders | 90.8 /100 | #131 | Exceptional 48.3% |