French Canadian vs Immigrants 12th Grade, No Diploma
COMPARE
French Canadian
Immigrants
12th Grade, No Diploma
12th Grade, No Diploma Comparison
French Canadians
Immigrants
92.6%
12TH GRADE, NO DIPLOMA
99.3/ 100
METRIC RATING
80th/ 347
METRIC RANK
88.2%
12TH GRADE, NO DIPLOMA
0.0/ 100
METRIC RATING
295th/ 347
METRIC RANK
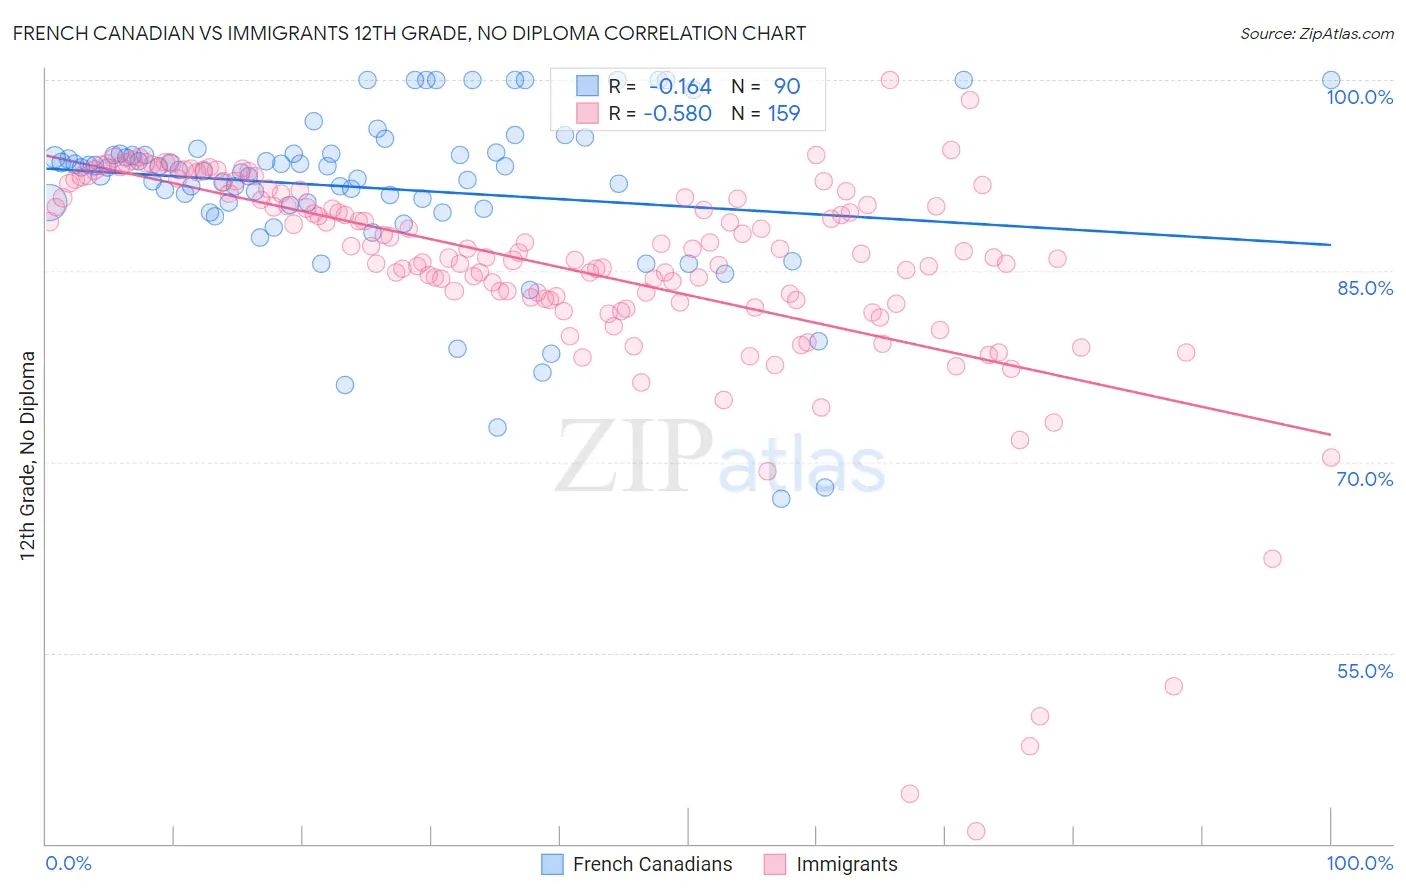
French Canadian vs Immigrants 12th Grade, No Diploma Correlation Chart
The statistical analysis conducted on geographies consisting of 502,678,956 people shows a poor negative correlation between the proportion of French Canadians and percentage of population with at least 12th grade (no diploma) education in the United States with a correlation coefficient (R) of -0.164 and weighted average of 92.6%. Similarly, the statistical analysis conducted on geographies consisting of 577,785,727 people shows a substantial negative correlation between the proportion of Immigrants and percentage of population with at least 12th grade (no diploma) education in the United States with a correlation coefficient (R) of -0.580 and weighted average of 88.2%, a difference of 4.9%.
12th Grade, No Diploma Correlation Summary
| Measurement | French Canadian | Immigrants |
| Minimum | 67.1% | 41.0% |
| Maximum | 100.0% | 100.0% |
| Range | 32.9% | 59.0% |
| Mean | 91.5% | 85.2% |
| Median | 93.0% | 86.4% |
| Interquartile 25% (IQ1) | 90.1% | 82.7% |
| Interquartile 75% (IQ3) | 94.2% | 91.1% |
| Interquartile Range (IQR) | 4.1% | 8.4% |
| Standard Deviation (Sample) | 6.6% | 9.1% |
| Standard Deviation (Population) | 6.6% | 9.0% |
Similar Demographics by 12th Grade, No Diploma
Demographics Similar to French Canadians by 12th Grade, No Diploma
In terms of 12th grade, no diploma, the demographic groups most similar to French Canadians are Romanian (92.6%, a difference of 0.010%), Cambodian (92.6%, a difference of 0.020%), Immigrants from Denmark (92.5%, a difference of 0.020%), Immigrants from Switzerland (92.5%, a difference of 0.020%), and Immigrants from Israel (92.5%, a difference of 0.030%).
| Demographics | Rating | Rank | 12th Grade, No Diploma |
| Burmese | 99.4 /100 | #73 | Exceptional 92.6% |
| Immigrants | Moldova | 99.4 /100 | #74 | Exceptional 92.6% |
| Native Hawaiians | 99.4 /100 | #75 | Exceptional 92.6% |
| French | 99.4 /100 | #76 | Exceptional 92.6% |
| Immigrants | England | 99.4 /100 | #77 | Exceptional 92.6% |
| Cambodians | 99.3 /100 | #78 | Exceptional 92.6% |
| Romanians | 99.3 /100 | #79 | Exceptional 92.6% |
| French Canadians | 99.3 /100 | #80 | Exceptional 92.6% |
| Immigrants | Denmark | 99.2 /100 | #81 | Exceptional 92.5% |
| Immigrants | Switzerland | 99.2 /100 | #82 | Exceptional 92.5% |
| Immigrants | Israel | 99.2 /100 | #83 | Exceptional 92.5% |
| Immigrants | Bulgaria | 99.1 /100 | #84 | Exceptional 92.5% |
| Immigrants | Saudi Arabia | 99.0 /100 | #85 | Exceptional 92.5% |
| Immigrants | Turkey | 98.9 /100 | #86 | Exceptional 92.4% |
| Immigrants | France | 98.8 /100 | #87 | Exceptional 92.4% |
Demographics Similar to Immigrants by 12th Grade, No Diploma
In terms of 12th grade, no diploma, the demographic groups most similar to Immigrants are Fijian (88.2%, a difference of 0.020%), Pueblo (88.2%, a difference of 0.030%), Guyanese (88.3%, a difference of 0.040%), Immigrants from Haiti (88.2%, a difference of 0.080%), and Japanese (88.3%, a difference of 0.11%).
| Demographics | Rating | Rank | 12th Grade, No Diploma |
| Immigrants | Fiji | 0.0 /100 | #288 | Tragic 88.6% |
| Dutch West Indians | 0.0 /100 | #289 | Tragic 88.5% |
| British West Indians | 0.0 /100 | #290 | Tragic 88.5% |
| Haitians | 0.0 /100 | #291 | Tragic 88.5% |
| Immigrants | Grenada | 0.0 /100 | #292 | Tragic 88.4% |
| Japanese | 0.0 /100 | #293 | Tragic 88.3% |
| Guyanese | 0.0 /100 | #294 | Tragic 88.3% |
| Immigrants | Immigrants | 0.0 /100 | #295 | Tragic 88.2% |
| Fijians | 0.0 /100 | #296 | Tragic 88.2% |
| Pueblo | 0.0 /100 | #297 | Tragic 88.2% |
| Immigrants | Haiti | 0.0 /100 | #298 | Tragic 88.2% |
| Nepalese | 0.0 /100 | #299 | Tragic 88.1% |
| Immigrants | Guyana | 0.0 /100 | #300 | Tragic 88.1% |
| Immigrants | Cambodia | 0.0 /100 | #301 | Tragic 88.1% |
| Ecuadorians | 0.0 /100 | #302 | Tragic 88.0% |