Finnish vs U.S. Virgin Islander 11th Grade
COMPARE
Finnish
U.S. Virgin Islander
11th Grade
11th Grade Comparison
Finns
U.S. Virgin Islanders
94.7%
11TH GRADE
100.0/ 100
METRIC RATING
10th/ 347
METRIC RANK
91.1%
11TH GRADE
0.2/ 100
METRIC RATING
268th/ 347
METRIC RANK
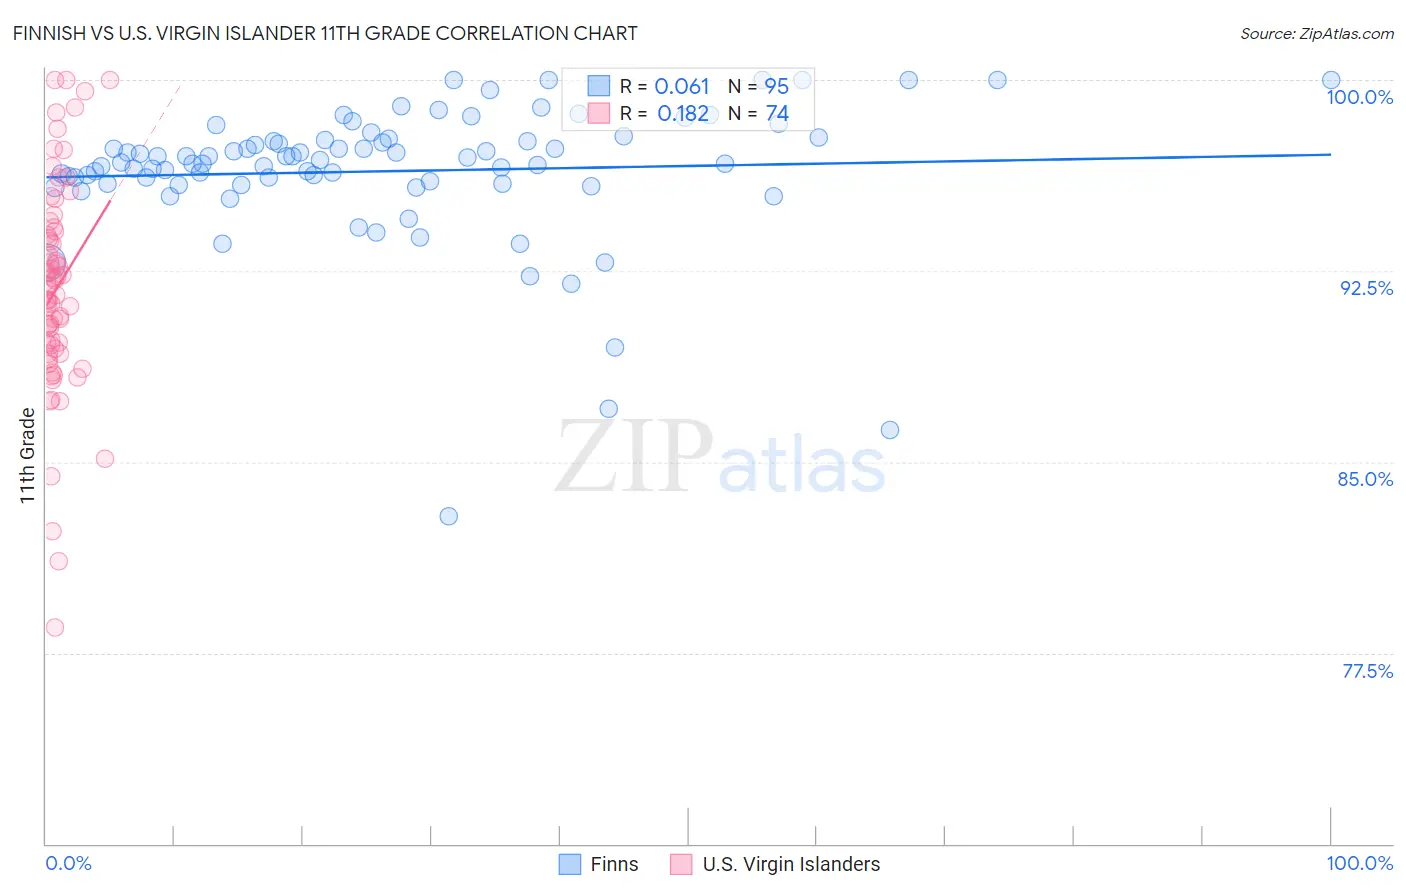
Finnish vs U.S. Virgin Islander 11th Grade Correlation Chart
The statistical analysis conducted on geographies consisting of 404,676,167 people shows a slight positive correlation between the proportion of Finns and percentage of population with at least 11th grade education in the United States with a correlation coefficient (R) of 0.061 and weighted average of 94.7%. Similarly, the statistical analysis conducted on geographies consisting of 87,529,315 people shows a poor positive correlation between the proportion of U.S. Virgin Islanders and percentage of population with at least 11th grade education in the United States with a correlation coefficient (R) of 0.182 and weighted average of 91.1%, a difference of 3.9%.
11th Grade Correlation Summary
| Measurement | Finnish | U.S. Virgin Islander |
| Minimum | 82.9% | 78.5% |
| Maximum | 100.0% | 100.0% |
| Range | 17.1% | 21.5% |
| Mean | 96.4% | 91.8% |
| Median | 96.7% | 91.7% |
| Interquartile 25% (IQ1) | 95.9% | 89.4% |
| Interquartile 75% (IQ3) | 97.7% | 94.1% |
| Interquartile Range (IQR) | 1.7% | 4.7% |
| Standard Deviation (Sample) | 2.7% | 4.2% |
| Standard Deviation (Population) | 2.7% | 4.2% |
Similar Demographics by 11th Grade
Demographics Similar to Finns by 11th Grade
In terms of 11th grade, the demographic groups most similar to Finns are German (94.7%, a difference of 0.0%), Latvian (94.7%, a difference of 0.0%), Chinese (94.6%, a difference of 0.040%), Danish (94.7%, a difference of 0.050%), and Polish (94.8%, a difference of 0.090%).
| Demographics | Rating | Rank | 11th Grade |
| Slovenes | 100.0 /100 | #3 | Exceptional 94.9% |
| Slovaks | 100.0 /100 | #4 | Exceptional 94.9% |
| Carpatho Rusyns | 100.0 /100 | #5 | Exceptional 94.8% |
| Lithuanians | 100.0 /100 | #6 | Exceptional 94.8% |
| Poles | 100.0 /100 | #7 | Exceptional 94.8% |
| Croatians | 100.0 /100 | #8 | Exceptional 94.7% |
| Danes | 100.0 /100 | #9 | Exceptional 94.7% |
| Finns | 100.0 /100 | #10 | Exceptional 94.7% |
| Germans | 100.0 /100 | #11 | Exceptional 94.7% |
| Latvians | 100.0 /100 | #12 | Exceptional 94.7% |
| Chinese | 100.0 /100 | #13 | Exceptional 94.6% |
| Eastern Europeans | 100.0 /100 | #14 | Exceptional 94.6% |
| Bulgarians | 100.0 /100 | #15 | Exceptional 94.5% |
| Immigrants | India | 100.0 /100 | #16 | Exceptional 94.5% |
| Luxembourgers | 100.0 /100 | #17 | Exceptional 94.5% |
Demographics Similar to U.S. Virgin Islanders by 11th Grade
In terms of 11th grade, the demographic groups most similar to U.S. Virgin Islanders are Ute (91.1%, a difference of 0.030%), Trinidadian and Tobagonian (91.1%, a difference of 0.060%), Immigrants from Jamaica (91.2%, a difference of 0.070%), Immigrants from Western Africa (91.2%, a difference of 0.080%), and Immigrants from Peru (91.0%, a difference of 0.090%).
| Demographics | Rating | Rank | 11th Grade |
| Taiwanese | 0.6 /100 | #261 | Tragic 91.3% |
| Immigrants | Uruguay | 0.5 /100 | #262 | Tragic 91.3% |
| Immigrants | Ghana | 0.3 /100 | #263 | Tragic 91.2% |
| Yup'ik | 0.3 /100 | #264 | Tragic 91.2% |
| Pueblo | 0.3 /100 | #265 | Tragic 91.2% |
| Immigrants | Western Africa | 0.3 /100 | #266 | Tragic 91.2% |
| Immigrants | Jamaica | 0.3 /100 | #267 | Tragic 91.2% |
| U.S. Virgin Islanders | 0.2 /100 | #268 | Tragic 91.1% |
| Ute | 0.2 /100 | #269 | Tragic 91.1% |
| Trinidadians and Tobagonians | 0.2 /100 | #270 | Tragic 91.1% |
| Immigrants | Peru | 0.1 /100 | #271 | Tragic 91.0% |
| West Indians | 0.1 /100 | #272 | Tragic 91.0% |
| Paiute | 0.1 /100 | #273 | Tragic 91.0% |
| Immigrants | Trinidad and Tobago | 0.1 /100 | #274 | Tragic 90.9% |
| Immigrants | South Eastern Asia | 0.1 /100 | #275 | Tragic 90.9% |