Finnish vs Immigrants from Latin America 8th Grade
COMPARE
Finnish
Immigrants from Latin America
8th Grade
8th Grade Comparison
Finns
Immigrants from Latin America
98.4%
8TH GRADE
100.0/ 100
METRIC RATING
3rd/ 347
METRIC RANK
91.7%
8TH GRADE
0.0/ 100
METRIC RATING
337th/ 347
METRIC RANK
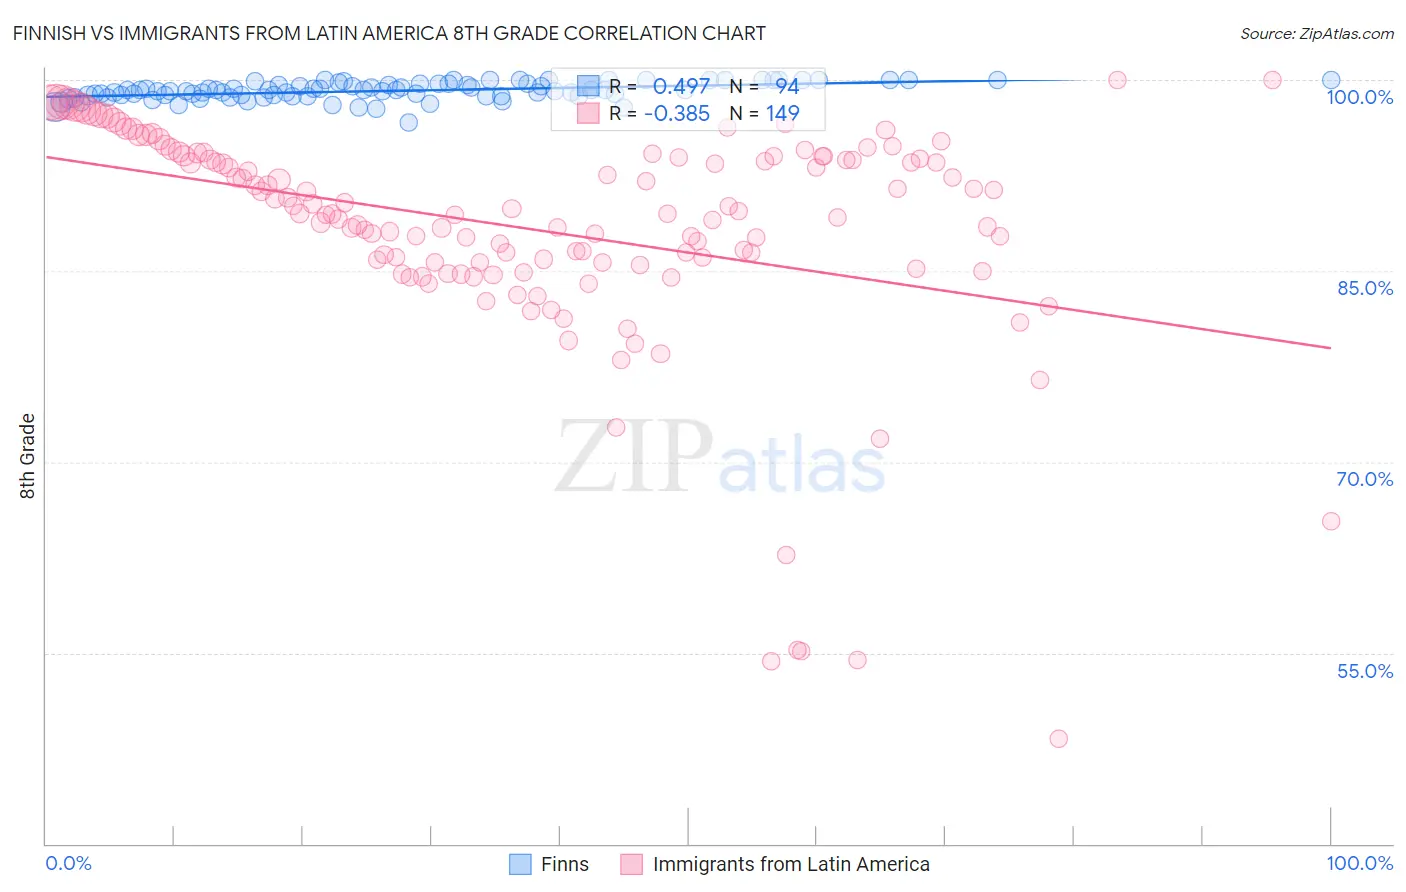
Finnish vs Immigrants from Latin America 8th Grade Correlation Chart
The statistical analysis conducted on geographies consisting of 46,910,222 people shows a moderate positive correlation between the proportion of Finns and percentage of population with at least 8th grade education in the United States with a correlation coefficient (R) of 0.497 and weighted average of 98.4%. Similarly, the statistical analysis conducted on geographies consisting of 558,651,799 people shows a mild negative correlation between the proportion of Immigrants from Latin America and percentage of population with at least 8th grade education in the United States with a correlation coefficient (R) of -0.385 and weighted average of 91.7%, a difference of 7.3%.
8th Grade Correlation Summary
| Measurement | Finnish | Immigrants from Latin America |
| Minimum | 96.7% | 48.3% |
| Maximum | 100.0% | 100.0% |
| Range | 3.3% | 51.7% |
| Mean | 99.1% | 88.2% |
| Median | 99.2% | 89.5% |
| Interquartile 25% (IQ1) | 98.8% | 85.6% |
| Interquartile 75% (IQ3) | 99.7% | 94.0% |
| Interquartile Range (IQR) | 0.90% | 8.4% |
| Standard Deviation (Sample) | 0.67% | 9.0% |
| Standard Deviation (Population) | 0.66% | 8.9% |
Similar Demographics by 8th Grade
Demographics Similar to Finns by 8th Grade
In terms of 8th grade, the demographic groups most similar to Finns are Carpatho Rusyn (98.1%, a difference of 0.23%), Ottawa (97.9%, a difference of 0.43%), Tsimshian (99.0%, a difference of 0.60%), Crow (99.0%, a difference of 0.69%), and Dutch (97.7%, a difference of 0.72%).
| Demographics | Rating | Rank | 8th Grade |
| Crow | 100.0 /100 | #1 | Exceptional 99.0% |
| Tsimshian | 100.0 /100 | #2 | Exceptional 99.0% |
| Finns | 100.0 /100 | #3 | Exceptional 98.4% |
| Carpatho Rusyns | 100.0 /100 | #4 | Exceptional 98.1% |
| Ottawa | 100.0 /100 | #5 | Exceptional 97.9% |
| Dutch | 100.0 /100 | #6 | Exceptional 97.7% |
| Norwegians | 100.0 /100 | #7 | Exceptional 97.6% |
| Slovaks | 100.0 /100 | #8 | Exceptional 97.6% |
| Germans | 100.0 /100 | #9 | Exceptional 97.5% |
| Slovenes | 100.0 /100 | #10 | Exceptional 97.5% |
| Poles | 100.0 /100 | #11 | Exceptional 97.4% |
| Swedes | 100.0 /100 | #12 | Exceptional 97.4% |
| Alaskan Athabascans | 100.0 /100 | #13 | Exceptional 97.3% |
| English | 100.0 /100 | #14 | Exceptional 97.3% |
| Pennsylvania Germans | 100.0 /100 | #15 | Exceptional 97.3% |
Demographics Similar to Immigrants from Latin America by 8th Grade
In terms of 8th grade, the demographic groups most similar to Immigrants from Latin America are Central American (91.6%, a difference of 0.14%), Immigrants from Honduras (91.9%, a difference of 0.23%), Mexican (91.4%, a difference of 0.37%), Mexican American Indian (92.1%, a difference of 0.42%), and Immigrants from Yemen (92.1%, a difference of 0.47%).
| Demographics | Rating | Rank | 8th Grade |
| Immigrants | Armenia | 0.0 /100 | #330 | Tragic 92.3% |
| Hondurans | 0.0 /100 | #331 | Tragic 92.3% |
| Immigrants | Dominican Republic | 0.0 /100 | #332 | Tragic 92.3% |
| Hispanics or Latinos | 0.0 /100 | #333 | Tragic 92.2% |
| Immigrants | Yemen | 0.0 /100 | #334 | Tragic 92.1% |
| Mexican American Indians | 0.0 /100 | #335 | Tragic 92.1% |
| Immigrants | Honduras | 0.0 /100 | #336 | Tragic 91.9% |
| Immigrants | Latin America | 0.0 /100 | #337 | Tragic 91.7% |
| Central Americans | 0.0 /100 | #338 | Tragic 91.6% |
| Mexicans | 0.0 /100 | #339 | Tragic 91.4% |
| Yakama | 0.0 /100 | #340 | Tragic 91.2% |
| Guatemalans | 0.0 /100 | #341 | Tragic 91.1% |
| Salvadorans | 0.0 /100 | #342 | Tragic 90.9% |
| Immigrants | Guatemala | 0.0 /100 | #343 | Tragic 90.7% |
| Immigrants | Central America | 0.0 /100 | #344 | Tragic 90.4% |