Finnish vs Immigrants from Brazil Professional Degree

COMPARE

Finnish
Race
Ancestry
AfghanAfricanAlaska NativeAlaskan AthabascanAlbanianAleutAlsatianAmericanApacheArabArapahoArgentineanArmenianAssyrian/Chaldean/SyriacAustralianAustrianBahamianBangladeshiBarbadianBasqueBelgianBelizeanBermudanBhutaneseBlackfeetBolivianBrazilianBritishBritish West IndianBulgarianBurmeseCajunCambodianCanadianCape VerdeanCarpatho RusynCelticCentral AmericanCentral American IndianCherokeeCheyenneChickasawChileanChineseChippewaChoctawColombianColvilleComancheCosta RicanCreeCreekCroatianCrowCubanCypriotCzechCzechoslovakianDanishDelawareDominicanDutchDutch West IndianEastern EuropeanEcuadorianEgyptianEnglishEstonianEthiopianEuropeanFijianFilipinoFinnishFrenchFrench American IndianFrench CanadianGermanGerman RussianGhanaianGreekGuamanian/ChamorroGuatemalanGuyaneseHaitianHmongHonduranHopiHoumaHungarianIcelanderIndian (Asian)IndonesianInupiatIranianIraqiIrishIroquoisIsraeliItalianJamaicanJapaneseJordanianKenyanKiowaKoreanLaotianLatvianLebaneseLiberianLithuanianLumbeeLuxembourgerMacedonianMalaysianMalteseMarshalleseMenomineeMexicanMexican American IndianMongolianMoroccanNative HawaiianNavajoNepaleseNew ZealanderNicaraguanNigerianNorthern EuropeanNorwegianOkinawanOsageOttawaPaiutePakistaniPalestinianPanamanianParaguayanPennsylvania GermanPeruvianPimaPolishPortuguesePotawatomiPuebloPuerto RicanPuget Sound SalishRomanianRussianSalvadoranSamoanScandinavianScotch-IrishScottishSeminoleSenegaleseSerbianShoshoneSierra LeoneanSiouxSlavicSlovakSloveneSomaliSouth AfricanSouth AmericanSouth American IndianSoviet UnionSpaniardSpanishSpanish AmericanSpanish American IndianSri LankanSubsaharan AfricanSudaneseSwedishSwissSyrianTaiwaneseThaiTlingit-HaidaTohono O'OdhamTonganTrinidadian and TobagonianTsimshianTurkishU.S. Virgin IslanderUgandanUkrainianUruguayanUteVenezuelanVietnameseWelshWest IndianYakamaYaquiYugoslavianYumanYup'ikZimbabwean
Immigration
NonimmigrantsImmigrantsAfghanistanAfricaAlbaniaArgentinaArmeniaAsiaAustraliaAustriaBahamasBangladeshBarbadosBelarusBelgiumBelizeBoliviaBosnia and HerzegovinaBulgariaBurma/MyanmarCabo VerdeCambodiaCameroonCanadaCaribbeanCentral AmericaChileChinaColombiaCongoCosta RicaCroatiaCubaCzechoslovakiaDenmarkDominicaDominican RepublicEastern AfricaEastern AsiaEastern EuropeEcuadorEgyptEl SalvadorEnglandEritreaEthiopiaEuropeFijiFranceGermanyGhanaGreeceGrenadaGuatemalaGuyanaHaitiHondurasHong KongHungaryIndiaIndonesiaIranIraqIrelandIsraelItalyJamaicaJapanJordanKazakhstanKenyaKoreaKuwaitLaosLatin AmericaLatviaLebanonLiberiaLithuaniaMalaysiaMexicoMicronesiaMiddle AfricaMoldovaMoroccoNepalNetherlandsNicaraguaNigeriaNorth AmericaNorth MacedoniaNorthern AfricaNorthern EuropeNorwayOceaniaPakistanPanamaPeruPhilippinesPolandPortugalRomaniaRussiaSaudi ArabiaScotlandSenegalSerbiaSierra LeoneSingaporeSomaliaSouth AfricaSouth AmericaSouth Central AsiaSouth Eastern AsiaSouthern EuropeSpainSri LankaSt. Vincent and the GrenadinesSudanSwedenSwitzerlandSyriaTaiwanThailandTrinidad and TobagoTurkeyUgandaUkraineUruguayUzbekistanVenezuelaVietnamWest IndiesWestern AfricaWestern AsiaWestern EuropeYemenZaireZimbabweAzores
Immigrants from Brazil
Race
Ancestry
AfghanAfricanAlaska NativeAlaskan AthabascanAlbanianAleutAlsatianAmericanApacheArabArapahoArgentineanArmenianAssyrian/Chaldean/SyriacAustralianAustrianBahamianBangladeshiBarbadianBasqueBelgianBelizeanBermudanBhutaneseBlackfeetBolivianBrazilianBritishBritish West IndianBulgarianBurmeseCajunCambodianCanadianCape VerdeanCarpatho RusynCelticCentral AmericanCentral American IndianCherokeeCheyenneChickasawChileanChineseChippewaChoctawColombianColvilleComancheCosta RicanCreeCreekCroatianCrowCubanCypriotCzechCzechoslovakianDanishDelawareDominicanDutchDutch West IndianEastern EuropeanEcuadorianEgyptianEnglishEstonianEthiopianEuropeanFijianFilipinoFrenchFrench American IndianFrench CanadianGermanGerman RussianGhanaianGreekGuamanian/ChamorroGuatemalanGuyaneseHaitianHmongHonduranHopiHoumaHungarianIcelanderIndian (Asian)IndonesianInupiatIranianIraqiIrishIroquoisIsraeliItalianJamaicanJapaneseJordanianKenyanKiowaKoreanLaotianLatvianLebaneseLiberianLithuanianLumbeeLuxembourgerMacedonianMalaysianMalteseMarshalleseMenomineeMexicanMexican American IndianMongolianMoroccanNative HawaiianNavajoNepaleseNew ZealanderNicaraguanNigerianNorthern EuropeanNorwegianOkinawanOsageOttawaPaiutePakistaniPalestinianPanamanianParaguayanPennsylvania GermanPeruvianPimaPolishPortuguesePotawatomiPuebloPuerto RicanPuget Sound SalishRomanianRussianSalvadoranSamoanScandinavianScotch-IrishScottishSeminoleSenegaleseSerbianShoshoneSierra LeoneanSiouxSlavicSlovakSloveneSomaliSouth AfricanSouth AmericanSouth American IndianSoviet UnionSpaniardSpanishSpanish AmericanSpanish American IndianSri LankanSubsaharan AfricanSudaneseSwedishSwissSyrianTaiwaneseThaiTlingit-HaidaTohono O'OdhamTonganTrinidadian and TobagonianTsimshianTurkishU.S. Virgin IslanderUgandanUkrainianUruguayanUteVenezuelanVietnameseWelshWest IndianYakamaYaquiYugoslavianYumanYup'ikZimbabwean
Immigration
NonimmigrantsImmigrantsAfghanistanAfricaAlbaniaArgentinaArmeniaAsiaAustraliaAustriaBahamasBangladeshBarbadosBelarusBelgiumBelizeBoliviaBosnia and HerzegovinaBrazilBulgariaBurma/MyanmarCabo VerdeCambodiaCameroonCanadaCaribbeanCentral AmericaChileChinaColombiaCongoCosta RicaCroatiaCubaCzechoslovakiaDenmarkDominicaDominican RepublicEastern AfricaEastern AsiaEastern EuropeEcuadorEgyptEl SalvadorEnglandEritreaEthiopiaEuropeFijiFranceGermanyGhanaGreeceGrenadaGuatemalaGuyanaHaitiHondurasHong KongHungaryIndiaIndonesiaIranIraqIrelandIsraelItalyJamaicaJapanJordanKazakhstanKenyaKoreaKuwaitLaosLatin AmericaLatviaLebanonLiberiaLithuaniaMalaysiaMexicoMicronesiaMiddle AfricaMoldovaMoroccoNepalNetherlandsNicaraguaNigeriaNorth AmericaNorth MacedoniaNorthern AfricaNorthern EuropeNorwayOceaniaPakistanPanamaPeruPhilippinesPolandPortugalRomaniaRussiaSaudi ArabiaScotlandSenegalSerbiaSierra LeoneSingaporeSomaliaSouth AfricaSouth AmericaSouth Central AsiaSouth Eastern AsiaSouthern EuropeSpainSri LankaSt. Vincent and the GrenadinesSudanSwedenSwitzerlandSyriaTaiwanThailandTrinidad and TobagoTurkeyUgandaUkraineUruguayUzbekistanVenezuelaVietnamWest IndiesWestern AfricaWestern AsiaWestern EuropeYemenZaireZimbabweAzores
Professional Degree
Income
Poverty
Unemployment
Labor Participation
Family Structure
Vehicle Availability
Education Level
Disability

Professional Degree Comparison

Finns

Immigrants from Brazil

Poor
Exceptional
4.2%
PROFESSIONAL DEGREE
18.7/ 100
METRIC RATING
201st/ 347
METRIC RANK
5.3%
PROFESSIONAL DEGREE
99.6/ 100
METRIC RATING
81st/ 347
METRIC RANK

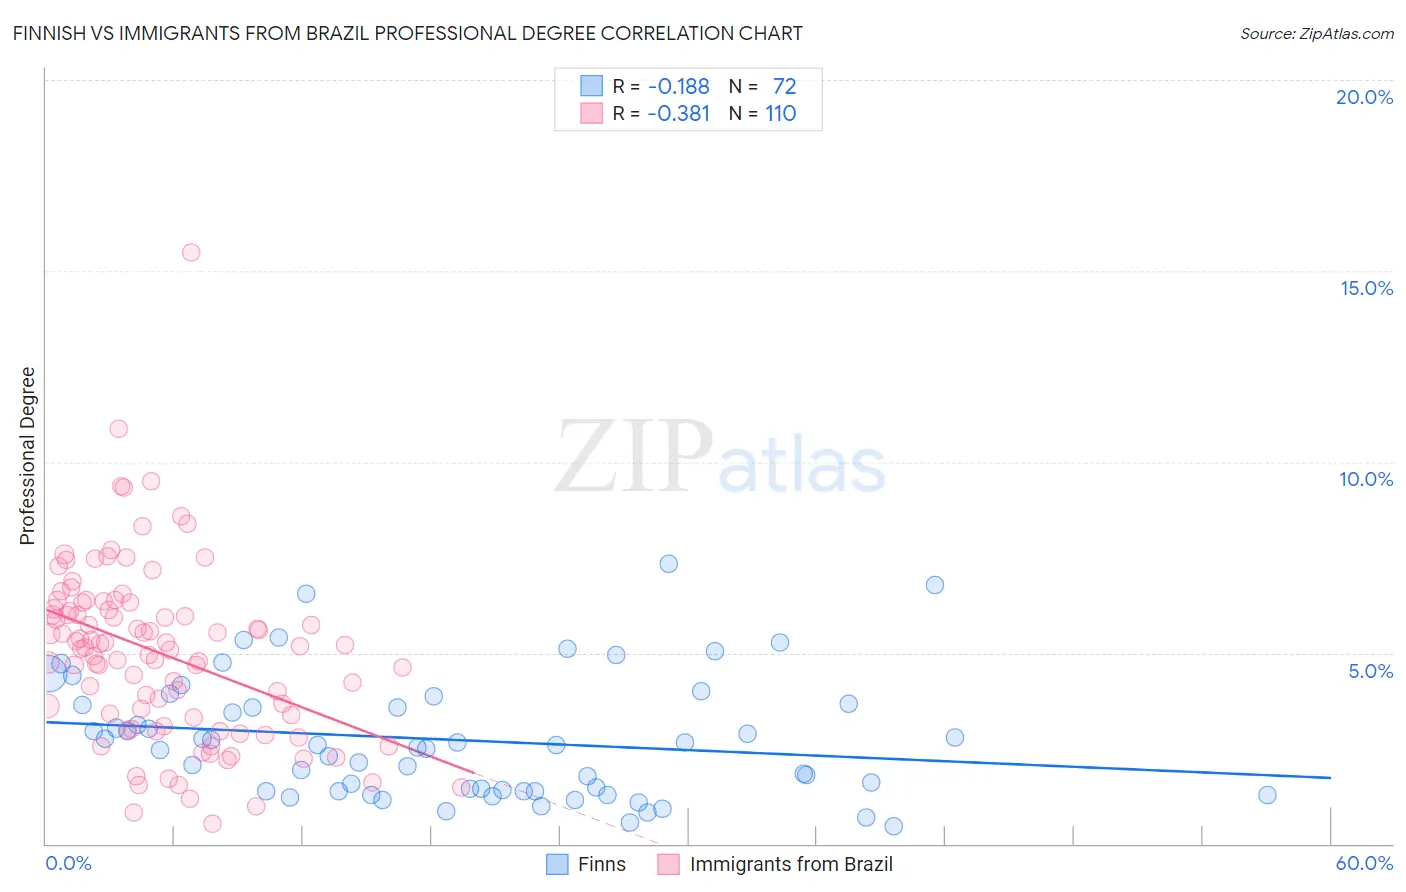
Finnish vs Immigrants from Brazil Professional Degree Correlation Chart

The statistical analysis conducted on geographies consisting of 403,408,940 people shows a poor negative correlation between the proportion of Finns and percentage of population with at least professional degree education in the United States with a correlation coefficient (R) of -0.188 and weighted average of 4.2%. Similarly, the statistical analysis conducted on geographies consisting of 342,594,044 people shows a mild negative correlation between the proportion of Immigrants from Brazil and percentage of population with at least professional degree education in the United States with a correlation coefficient (R) of -0.381 and weighted average of 5.3%, a difference of 27.3%.
Finnish vs Immigrants from Brazil Professional Degree

Professional Degree Correlation Summary

MeasurementFinnishImmigrants from Brazil
Minimum0.47%0.54%
Maximum7.3%15.5%
Range6.9%15.0%
Mean2.7%5.0%
Median2.5%5.2%
Interquartile 25% (IQ1)1.4%3.3%
Interquartile 75% (IQ3)3.6%6.1%
Interquartile Range (IQR)2.3%2.9%
Standard Deviation (Sample)1.6%2.3%
Standard Deviation (Population)1.6%2.3%

Similar Demographics by Professional Degree

Demographics Similar to Finns by Professional Degree

In terms of professional degree, the demographic groups most similar to Finns are Immigrants from North Macedonia (4.2%, a difference of 0.36%), Immigrants from Iraq (4.2%, a difference of 0.43%), Norwegian (4.2%, a difference of 0.44%), Panamanian (4.1%, a difference of 0.76%), and Barbadian (4.1%, a difference of 0.79%).
DemographicsRating | RankProfessional Degree
Scandinavians
25.8
/100
|
#194
Fair
4.2%
Nigerians
24.6
/100
|
#195
Fair
4.2%
Spanish
23.0
/100
|
#196
Fair
4.2%
Czechoslovakians
22.4
/100
|
#197
Fair
4.2%
Immigrants | Middle Africa
22.1
/100
|
#198
Fair
4.2%
Norwegians
20.5
/100
|
#199
Fair
4.2%
Immigrants | North Macedonia
20.2
/100
|
#200
Fair
4.2%
Finns
18.7
/100
|
#201
Poor
4.2%
Immigrants | Iraq
17.1
/100
|
#202
Poor
4.2%
Panamanians
15.9
/100
|
#203
Poor
4.1%
Barbadians
15.8
/100
|
#204
Poor
4.1%
Somalis
14.8
/100
|
#205
Poor
4.1%
Yugoslavians
13.4
/100
|
#206
Poor
4.1%
Sub-Saharan Africans
12.8
/100
|
#207
Poor
4.1%
Immigrants | Somalia
12.5
/100
|
#208
Poor
4.1%

Demographics Similar to Immigrants from Brazil by Professional Degree

In terms of professional degree, the demographic groups most similar to Immigrants from Brazil are Immigrants from England (5.3%, a difference of 0.010%), Immigrants from North America (5.3%, a difference of 0.40%), Romanian (5.3%, a difference of 0.50%), Armenian (5.3%, a difference of 0.57%), and Immigrants from Ethiopia (5.3%, a difference of 0.61%).
DemographicsRating | RankProfessional Degree
Ethiopians
99.7
/100
|
#74
Exceptional
5.4%
Immigrants | Indonesia
99.7
/100
|
#75
Exceptional
5.3%
Immigrants | Canada
99.7
/100
|
#76
Exceptional
5.3%
Immigrants | Ethiopia
99.7
/100
|
#77
Exceptional
5.3%
Armenians
99.7
/100
|
#78
Exceptional
5.3%
Immigrants | North America
99.7
/100
|
#79
Exceptional
5.3%
Immigrants | England
99.6
/100
|
#80
Exceptional
5.3%
Immigrants | Brazil
99.6
/100
|
#81
Exceptional
5.3%
Romanians
99.6
/100
|
#82
Exceptional
5.3%
Carpatho Rusyns
99.6
/100
|
#83
Exceptional
5.3%
Immigrants | Croatia
99.6
/100
|
#84
Exceptional
5.3%
Immigrants | Zimbabwe
99.6
/100
|
#85
Exceptional
5.3%
Greeks
99.6
/100
|
#86
Exceptional
5.3%
Immigrants | Chile
99.5
/100
|
#87
Exceptional
5.3%
Egyptians
99.5
/100
|
#88
Exceptional
5.3%