Filipino vs Finnish Associate's Degree
COMPARE
Filipino
Finnish
Associate's Degree
Associate's Degree Comparison
Filipinos
Finns
59.8%
ASSOCIATE'S DEGREE
100.0/ 100
METRIC RATING
1st/ 347
METRIC RANK
46.3%
ASSOCIATE'S DEGREE
48.5/ 100
METRIC RATING
176th/ 347
METRIC RANK
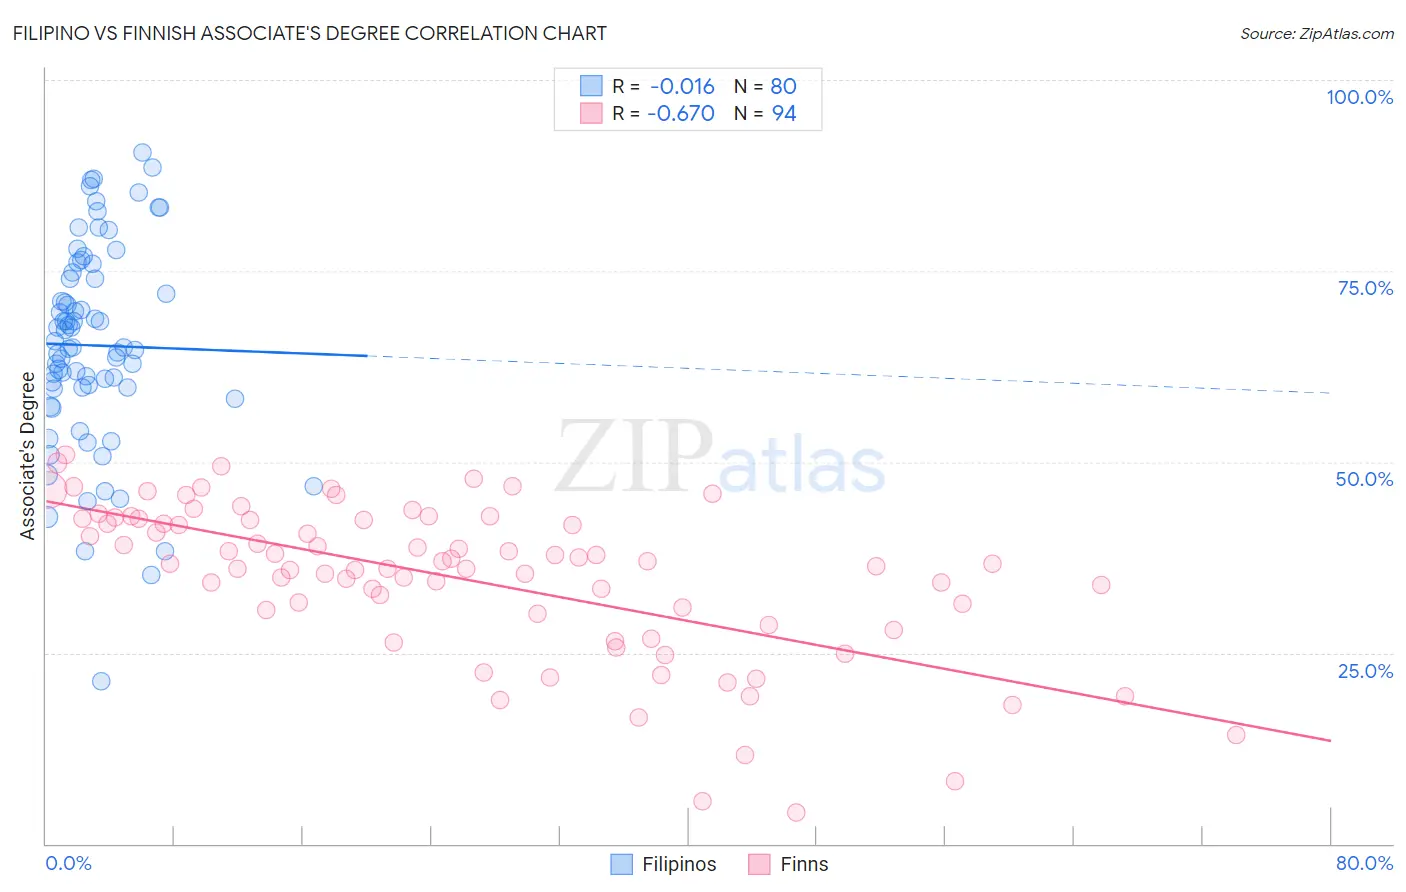
Filipino vs Finnish Associate's Degree Correlation Chart
The statistical analysis conducted on geographies consisting of 254,337,502 people shows no correlation between the proportion of Filipinos and percentage of population with at least associate's degree education in the United States with a correlation coefficient (R) of -0.016 and weighted average of 59.8%. Similarly, the statistical analysis conducted on geographies consisting of 404,653,186 people shows a significant negative correlation between the proportion of Finns and percentage of population with at least associate's degree education in the United States with a correlation coefficient (R) of -0.670 and weighted average of 46.3%, a difference of 29.1%.
Associate's Degree Correlation Summary
| Measurement | Filipino | Finnish |
| Minimum | 21.2% | 4.1% |
| Maximum | 90.5% | 50.9% |
| Range | 69.3% | 46.8% |
| Mean | 65.3% | 34.7% |
| Median | 65.0% | 36.6% |
| Interquartile 25% (IQ1) | 59.7% | 30.2% |
| Interquartile 75% (IQ3) | 74.4% | 42.4% |
| Interquartile Range (IQR) | 14.7% | 12.3% |
| Standard Deviation (Sample) | 13.5% | 10.2% |
| Standard Deviation (Population) | 13.4% | 10.1% |
Similar Demographics by Associate's Degree
Demographics Similar to Filipinos by Associate's Degree
In terms of associate's degree, the demographic groups most similar to Filipinos are Immigrants from Singapore (58.9%, a difference of 1.5%), Immigrants from India (58.5%, a difference of 2.1%), Immigrants from Taiwan (58.4%, a difference of 2.4%), Iranian (58.2%, a difference of 2.8%), and Okinawan (57.7%, a difference of 3.7%).
| Demographics | Rating | Rank | Associate's Degree |
| Filipinos | 100.0 /100 | #1 | Exceptional 59.8% |
| Immigrants | Singapore | 100.0 /100 | #2 | Exceptional 58.9% |
| Immigrants | India | 100.0 /100 | #3 | Exceptional 58.5% |
| Immigrants | Taiwan | 100.0 /100 | #4 | Exceptional 58.4% |
| Iranians | 100.0 /100 | #5 | Exceptional 58.2% |
| Okinawans | 100.0 /100 | #6 | Exceptional 57.7% |
| Immigrants | Iran | 100.0 /100 | #7 | Exceptional 57.7% |
| Thais | 100.0 /100 | #8 | Exceptional 57.4% |
| Immigrants | Israel | 100.0 /100 | #9 | Exceptional 56.8% |
| Cypriots | 100.0 /100 | #10 | Exceptional 56.4% |
| Immigrants | Australia | 100.0 /100 | #11 | Exceptional 55.8% |
| Immigrants | South Central Asia | 100.0 /100 | #12 | Exceptional 55.7% |
| Immigrants | China | 100.0 /100 | #13 | Exceptional 55.5% |
| Immigrants | Hong Kong | 100.0 /100 | #14 | Exceptional 55.4% |
| Immigrants | Eastern Asia | 100.0 /100 | #15 | Exceptional 55.4% |
Demographics Similar to Finns by Associate's Degree
In terms of associate's degree, the demographic groups most similar to Finns are Slovak (46.3%, a difference of 0.010%), Belgian (46.3%, a difference of 0.020%), Immigrants from Bosnia and Herzegovina (46.3%, a difference of 0.020%), Sri Lankan (46.3%, a difference of 0.070%), and English (46.4%, a difference of 0.11%).
| Demographics | Rating | Rank | Associate's Degree |
| Uruguayans | 55.4 /100 | #169 | Average 46.5% |
| Irish | 53.6 /100 | #170 | Average 46.5% |
| Basques | 52.8 /100 | #171 | Average 46.5% |
| Peruvians | 50.5 /100 | #172 | Average 46.4% |
| Immigrants | Iraq | 50.3 /100 | #173 | Average 46.4% |
| English | 50.0 /100 | #174 | Average 46.4% |
| Belgians | 48.9 /100 | #175 | Average 46.3% |
| Finns | 48.5 /100 | #176 | Average 46.3% |
| Slovaks | 48.4 /100 | #177 | Average 46.3% |
| Immigrants | Bosnia and Herzegovina | 48.3 /100 | #178 | Average 46.3% |
| Sri Lankans | 47.6 /100 | #179 | Average 46.3% |
| Bermudans | 46.4 /100 | #180 | Average 46.2% |
| Immigrants | Colombia | 41.3 /100 | #181 | Average 46.0% |
| Swiss | 40.4 /100 | #182 | Average 46.0% |
| Yugoslavians | 40.2 /100 | #183 | Average 46.0% |