Fijian vs New Zealander Professional Degree
COMPARE
Fijian
New Zealander
Professional Degree
Professional Degree Comparison
Fijians
New Zealanders
2.9%
PROFESSIONAL DEGREE
0.0/ 100
METRIC RATING
336th/ 347
METRIC RANK
6.0%
PROFESSIONAL DEGREE
100.0/ 100
METRIC RATING
41st/ 347
METRIC RANK
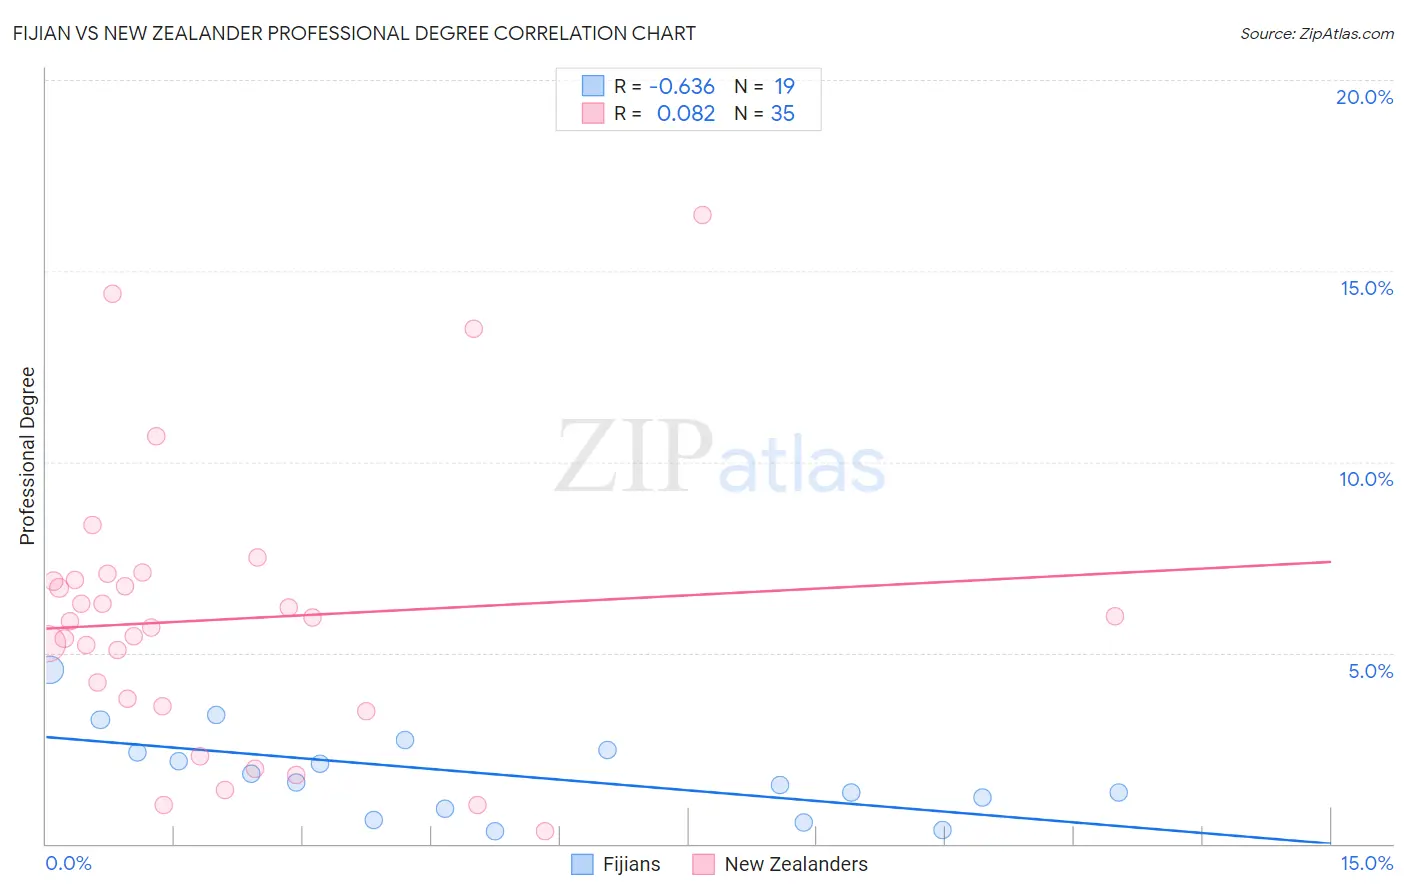
Fijian vs New Zealander Professional Degree Correlation Chart
The statistical analysis conducted on geographies consisting of 55,894,250 people shows a significant negative correlation between the proportion of Fijians and percentage of population with at least professional degree education in the United States with a correlation coefficient (R) of -0.636 and weighted average of 2.9%. Similarly, the statistical analysis conducted on geographies consisting of 106,863,101 people shows a slight positive correlation between the proportion of New Zealanders and percentage of population with at least professional degree education in the United States with a correlation coefficient (R) of 0.082 and weighted average of 6.0%, a difference of 103.5%.
Professional Degree Correlation Summary
| Measurement | Fijian | New Zealander |
| Minimum | 0.32% | 0.31% |
| Maximum | 4.6% | 16.5% |
| Range | 4.2% | 16.1% |
| Mean | 1.8% | 5.9% |
| Median | 1.6% | 5.8% |
| Interquartile 25% (IQ1) | 0.93% | 3.6% |
| Interquartile 75% (IQ3) | 2.4% | 6.9% |
| Interquartile Range (IQR) | 1.5% | 3.3% |
| Standard Deviation (Sample) | 1.1% | 3.6% |
| Standard Deviation (Population) | 1.1% | 3.6% |
Similar Demographics by Professional Degree
Demographics Similar to Fijians by Professional Degree
In terms of professional degree, the demographic groups most similar to Fijians are Native/Alaskan (3.0%, a difference of 1.0%), Pennsylvania German (3.0%, a difference of 1.6%), Arapaho (2.9%, a difference of 1.8%), Navajo (2.9%, a difference of 1.9%), and Immigrants from Central America (2.9%, a difference of 2.0%).
| Demographics | Rating | Rank | Professional Degree |
| Bangladeshis | 0.0 /100 | #329 | Tragic 3.1% |
| Immigrants | Cabo Verde | 0.0 /100 | #330 | Tragic 3.1% |
| Kiowa | 0.0 /100 | #331 | Tragic 3.1% |
| Yakama | 0.0 /100 | #332 | Tragic 3.1% |
| Puget Sound Salish | 0.0 /100 | #333 | Tragic 3.1% |
| Pennsylvania Germans | 0.0 /100 | #334 | Tragic 3.0% |
| Natives/Alaskans | 0.0 /100 | #335 | Tragic 3.0% |
| Fijians | 0.0 /100 | #336 | Tragic 2.9% |
| Arapaho | 0.0 /100 | #337 | Tragic 2.9% |
| Navajo | 0.0 /100 | #338 | Tragic 2.9% |
| Immigrants | Central America | 0.0 /100 | #339 | Tragic 2.9% |
| Yup'ik | 0.0 /100 | #340 | Tragic 2.9% |
| Tohono O'odham | 0.0 /100 | #341 | Tragic 2.8% |
| Immigrants | Azores | 0.0 /100 | #342 | Tragic 2.8% |
| Mexicans | 0.0 /100 | #343 | Tragic 2.7% |
Demographics Similar to New Zealanders by Professional Degree
In terms of professional degree, the demographic groups most similar to New Zealanders are Estonian (6.0%, a difference of 0.010%), Cambodian (6.0%, a difference of 0.18%), Immigrants from Saudi Arabia (5.9%, a difference of 0.33%), Argentinean (5.9%, a difference of 0.49%), and Immigrants from South Africa (6.0%, a difference of 0.66%).
| Demographics | Rating | Rank | Professional Degree |
| Mongolians | 100.0 /100 | #34 | Exceptional 6.1% |
| Immigrants | Korea | 100.0 /100 | #35 | Exceptional 6.1% |
| Immigrants | Russia | 100.0 /100 | #36 | Exceptional 6.0% |
| Immigrants | Austria | 100.0 /100 | #37 | Exceptional 6.0% |
| Immigrants | Norway | 100.0 /100 | #38 | Exceptional 6.0% |
| Immigrants | South Africa | 100.0 /100 | #39 | Exceptional 6.0% |
| Cambodians | 100.0 /100 | #40 | Exceptional 6.0% |
| New Zealanders | 100.0 /100 | #41 | Exceptional 6.0% |
| Estonians | 100.0 /100 | #42 | Exceptional 6.0% |
| Immigrants | Saudi Arabia | 100.0 /100 | #43 | Exceptional 5.9% |
| Argentineans | 100.0 /100 | #44 | Exceptional 5.9% |
| Immigrants | South Central Asia | 100.0 /100 | #45 | Exceptional 5.9% |
| Immigrants | Argentina | 100.0 /100 | #46 | Exceptional 5.9% |
| Australians | 100.0 /100 | #47 | Exceptional 5.9% |
| Paraguayans | 100.0 /100 | #48 | Exceptional 5.9% |