Fijian vs Immigrants from Uzbekistan 10th Grade
COMPARE
Fijian
Immigrants from Uzbekistan
10th Grade
10th Grade Comparison
Fijians
Immigrants from Uzbekistan
91.5%
10TH GRADE
0.0/ 100
METRIC RATING
297th/ 347
METRIC RANK
92.6%
10TH GRADE
0.5/ 100
METRIC RATING
260th/ 347
METRIC RANK
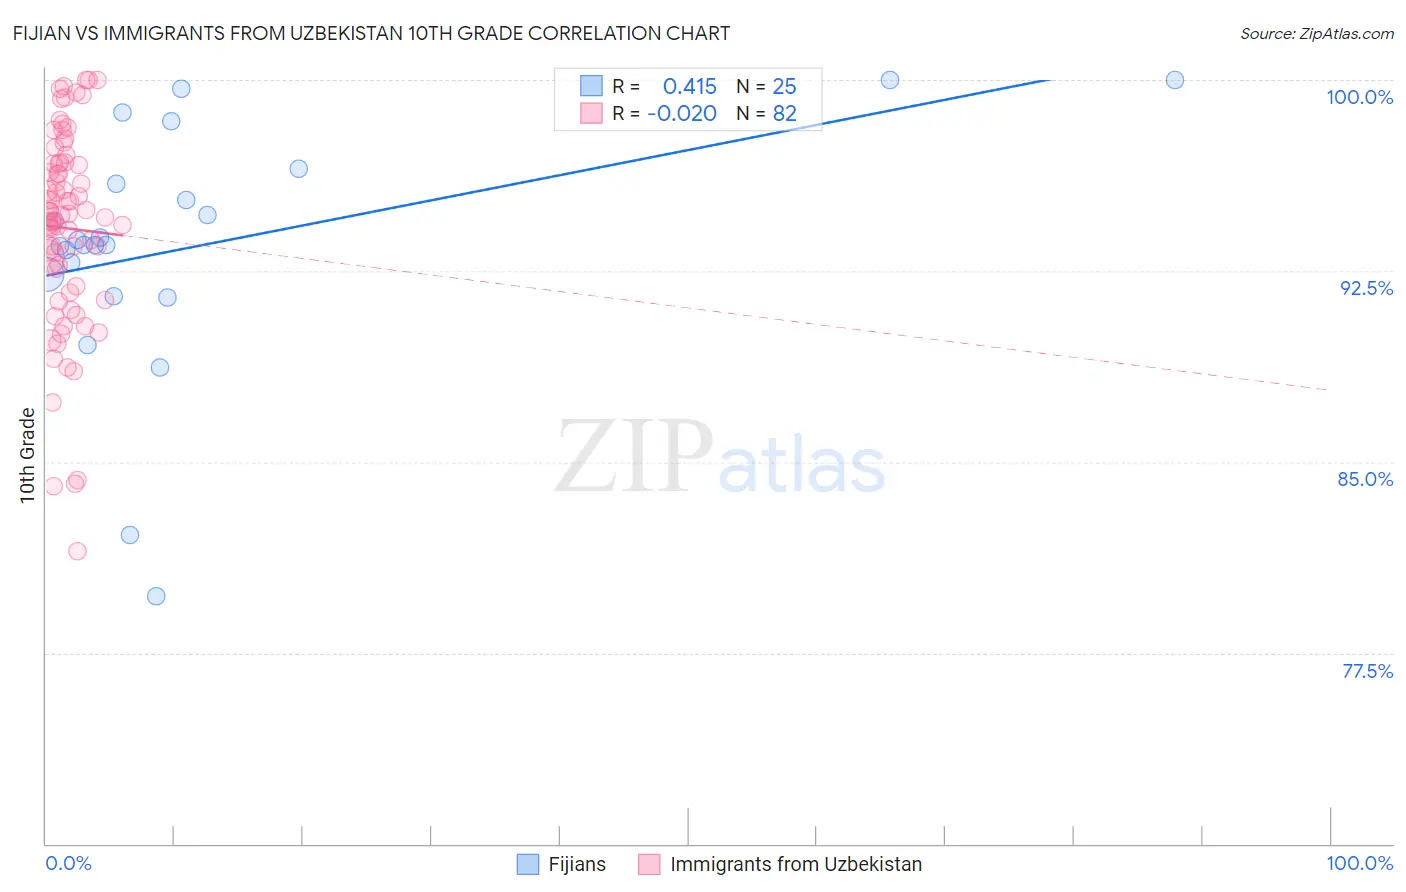
Fijian vs Immigrants from Uzbekistan 10th Grade Correlation Chart
The statistical analysis conducted on geographies consisting of 55,948,842 people shows a moderate positive correlation between the proportion of Fijians and percentage of population with at least 10th grade education in the United States with a correlation coefficient (R) of 0.415 and weighted average of 91.5%. Similarly, the statistical analysis conducted on geographies consisting of 118,684,730 people shows no correlation between the proportion of Immigrants from Uzbekistan and percentage of population with at least 10th grade education in the United States with a correlation coefficient (R) of -0.020 and weighted average of 92.6%, a difference of 1.2%.
10th Grade Correlation Summary
| Measurement | Fijian | Immigrants from Uzbekistan |
| Minimum | 79.7% | 81.5% |
| Maximum | 100.0% | 100.0% |
| Range | 20.3% | 18.5% |
| Mean | 93.5% | 94.2% |
| Median | 93.5% | 94.7% |
| Interquartile 25% (IQ1) | 91.9% | 91.9% |
| Interquartile 75% (IQ3) | 96.2% | 96.7% |
| Interquartile Range (IQR) | 4.3% | 4.8% |
| Standard Deviation (Sample) | 4.8% | 3.9% |
| Standard Deviation (Population) | 4.7% | 3.9% |
Similar Demographics by 10th Grade
Demographics Similar to Fijians by 10th Grade
In terms of 10th grade, the demographic groups most similar to Fijians are Cuban (91.5%, a difference of 0.020%), Immigrants from Haiti (91.4%, a difference of 0.10%), Immigrants from Grenada (91.6%, a difference of 0.14%), Guyanese (91.4%, a difference of 0.15%), and Lumbee (91.7%, a difference of 0.27%).
| Demographics | Rating | Rank | 10th Grade |
| British West Indians | 0.0 /100 | #290 | Tragic 91.8% |
| Immigrants | West Indies | 0.0 /100 | #291 | Tragic 91.8% |
| Immigrants | Burma/Myanmar | 0.0 /100 | #292 | Tragic 91.8% |
| Indonesians | 0.0 /100 | #293 | Tragic 91.8% |
| Haitians | 0.0 /100 | #294 | Tragic 91.8% |
| Lumbee | 0.0 /100 | #295 | Tragic 91.7% |
| Immigrants | Grenada | 0.0 /100 | #296 | Tragic 91.6% |
| Fijians | 0.0 /100 | #297 | Tragic 91.5% |
| Cubans | 0.0 /100 | #298 | Tragic 91.5% |
| Immigrants | Haiti | 0.0 /100 | #299 | Tragic 91.4% |
| Guyanese | 0.0 /100 | #300 | Tragic 91.4% |
| Japanese | 0.0 /100 | #301 | Tragic 91.2% |
| Immigrants | Guyana | 0.0 /100 | #302 | Tragic 91.2% |
| Immigrants | Vietnam | 0.0 /100 | #303 | Tragic 91.2% |
| Pima | 0.0 /100 | #304 | Tragic 91.2% |
Demographics Similar to Immigrants from Uzbekistan by 10th Grade
In terms of 10th grade, the demographic groups most similar to Immigrants from Uzbekistan are Immigrants from Jamaica (92.6%, a difference of 0.010%), Paiute (92.6%, a difference of 0.040%), Immigrants from Costa Rica (92.7%, a difference of 0.050%), Immigrants from South America (92.6%, a difference of 0.050%), and Apache (92.6%, a difference of 0.050%).
| Demographics | Rating | Rank | 10th Grade |
| Ghanaians | 0.9 /100 | #253 | Tragic 92.8% |
| Armenians | 0.9 /100 | #254 | Tragic 92.7% |
| Immigrants | Bolivia | 0.7 /100 | #255 | Tragic 92.7% |
| Immigrants | Nigeria | 0.7 /100 | #256 | Tragic 92.7% |
| U.S. Virgin Islanders | 0.7 /100 | #257 | Tragic 92.7% |
| Immigrants | Costa Rica | 0.6 /100 | #258 | Tragic 92.7% |
| Immigrants | Jamaica | 0.5 /100 | #259 | Tragic 92.6% |
| Immigrants | Uzbekistan | 0.5 /100 | #260 | Tragic 92.6% |
| Paiute | 0.4 /100 | #261 | Tragic 92.6% |
| Immigrants | South America | 0.4 /100 | #262 | Tragic 92.6% |
| Apache | 0.4 /100 | #263 | Tragic 92.6% |
| Peruvians | 0.4 /100 | #264 | Tragic 92.6% |
| Dutch West Indians | 0.4 /100 | #265 | Tragic 92.6% |
| Immigrants | Philippines | 0.4 /100 | #266 | Tragic 92.6% |
| Taiwanese | 0.3 /100 | #267 | Tragic 92.5% |