European vs Eastern European 12th Grade, No Diploma
COMPARE
European
Eastern European
12th Grade, No Diploma
12th Grade, No Diploma Comparison
Europeans
Eastern Europeans
93.1%
12TH GRADE, NO DIPLOMA
99.9/ 100
METRIC RATING
32nd/ 347
METRIC RANK
93.5%
12TH GRADE, NO DIPLOMA
100.0/ 100
METRIC RATING
12th/ 347
METRIC RANK
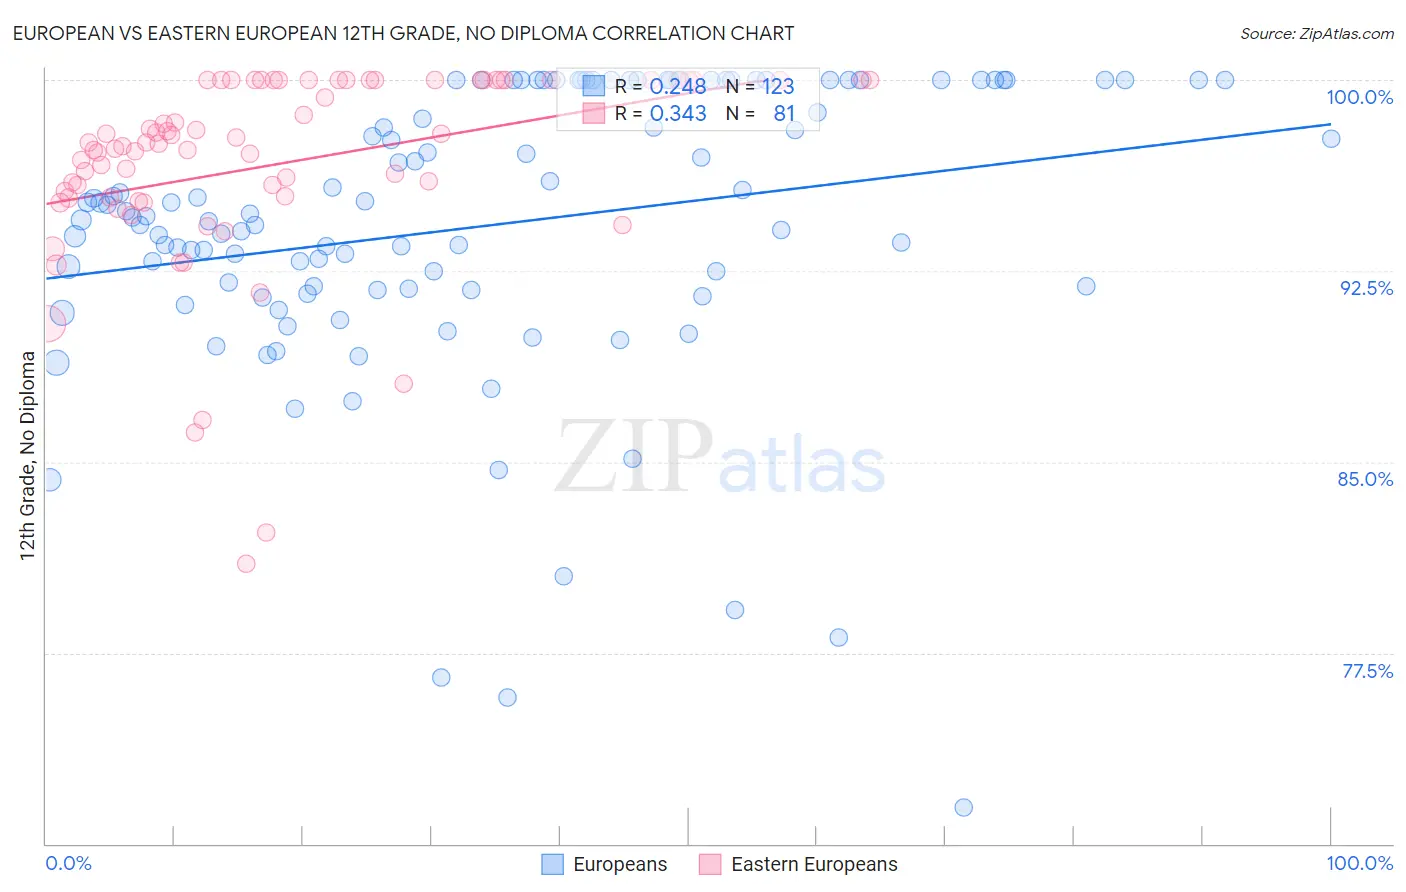
European vs Eastern European 12th Grade, No Diploma Correlation Chart
The statistical analysis conducted on geographies consisting of 561,829,322 people shows a weak positive correlation between the proportion of Europeans and percentage of population with at least 12th grade (no diploma) education in the United States with a correlation coefficient (R) of 0.248 and weighted average of 93.1%. Similarly, the statistical analysis conducted on geographies consisting of 461,247,615 people shows a mild positive correlation between the proportion of Eastern Europeans and percentage of population with at least 12th grade (no diploma) education in the United States with a correlation coefficient (R) of 0.343 and weighted average of 93.5%, a difference of 0.46%.
12th Grade, No Diploma Correlation Summary
| Measurement | European | Eastern European |
| Minimum | 71.4% | 81.0% |
| Maximum | 100.0% | 100.0% |
| Range | 28.6% | 19.0% |
| Mean | 94.3% | 96.7% |
| Median | 94.6% | 97.5% |
| Interquartile 25% (IQ1) | 91.8% | 95.4% |
| Interquartile 75% (IQ3) | 100.0% | 100.0% |
| Interquartile Range (IQR) | 8.2% | 4.6% |
| Standard Deviation (Sample) | 5.7% | 3.9% |
| Standard Deviation (Population) | 5.6% | 3.9% |
Demographics Similar to Europeans and Eastern Europeans by 12th Grade, No Diploma
In terms of 12th grade, no diploma, the demographic groups most similar to Europeans are Immigrants from Ireland (93.1%, a difference of 0.010%), Iranian (93.1%, a difference of 0.030%), Immigrants from Lithuania (93.1%, a difference of 0.030%), Immigrants from Northern Europe (93.1%, a difference of 0.040%), and Cypriot (93.1%, a difference of 0.080%). Similarly, the demographic groups most similar to Eastern Europeans are Danish (93.5%, a difference of 0.020%), Bulgarian (93.5%, a difference of 0.040%), Finnish (93.4%, a difference of 0.14%), Maltese (93.3%, a difference of 0.18%), and Luxembourger (93.3%, a difference of 0.20%).
| Demographics | Rating | Rank | 12th Grade, No Diploma |
| Eastern Europeans | 100.0 /100 | #12 | Exceptional 93.5% |
| Danes | 100.0 /100 | #13 | Exceptional 93.5% |
| Bulgarians | 100.0 /100 | #14 | Exceptional 93.5% |
| Finns | 100.0 /100 | #15 | Exceptional 93.4% |
| Maltese | 100.0 /100 | #16 | Exceptional 93.3% |
| Luxembourgers | 100.0 /100 | #17 | Exceptional 93.3% |
| Immigrants | Singapore | 99.9 /100 | #18 | Exceptional 93.3% |
| Germans | 99.9 /100 | #19 | Exceptional 93.3% |
| Filipinos | 99.9 /100 | #20 | Exceptional 93.2% |
| Italians | 99.9 /100 | #21 | Exceptional 93.2% |
| Estonians | 99.9 /100 | #22 | Exceptional 93.2% |
| Scandinavians | 99.9 /100 | #23 | Exceptional 93.2% |
| Thais | 99.9 /100 | #24 | Exceptional 93.2% |
| Czechs | 99.9 /100 | #25 | Exceptional 93.2% |
| Russians | 99.9 /100 | #26 | Exceptional 93.2% |
| Cypriots | 99.9 /100 | #27 | Exceptional 93.1% |
| Immigrants | Northern Europe | 99.9 /100 | #28 | Exceptional 93.1% |
| Iranians | 99.9 /100 | #29 | Exceptional 93.1% |
| Immigrants | Lithuania | 99.9 /100 | #30 | Exceptional 93.1% |
| Immigrants | Ireland | 99.9 /100 | #31 | Exceptional 93.1% |
| Europeans | 99.9 /100 | #32 | Exceptional 93.1% |