Ethiopian vs Immigrants from Mexico 8th Grade
COMPARE
Ethiopian
Immigrants from Mexico
8th Grade
8th Grade Comparison
Ethiopians
Immigrants from Mexico
95.1%
8TH GRADE
2.0/ 100
METRIC RATING
240th/ 347
METRIC RANK
90.2%
8TH GRADE
0.0/ 100
METRIC RATING
346th/ 347
METRIC RANK
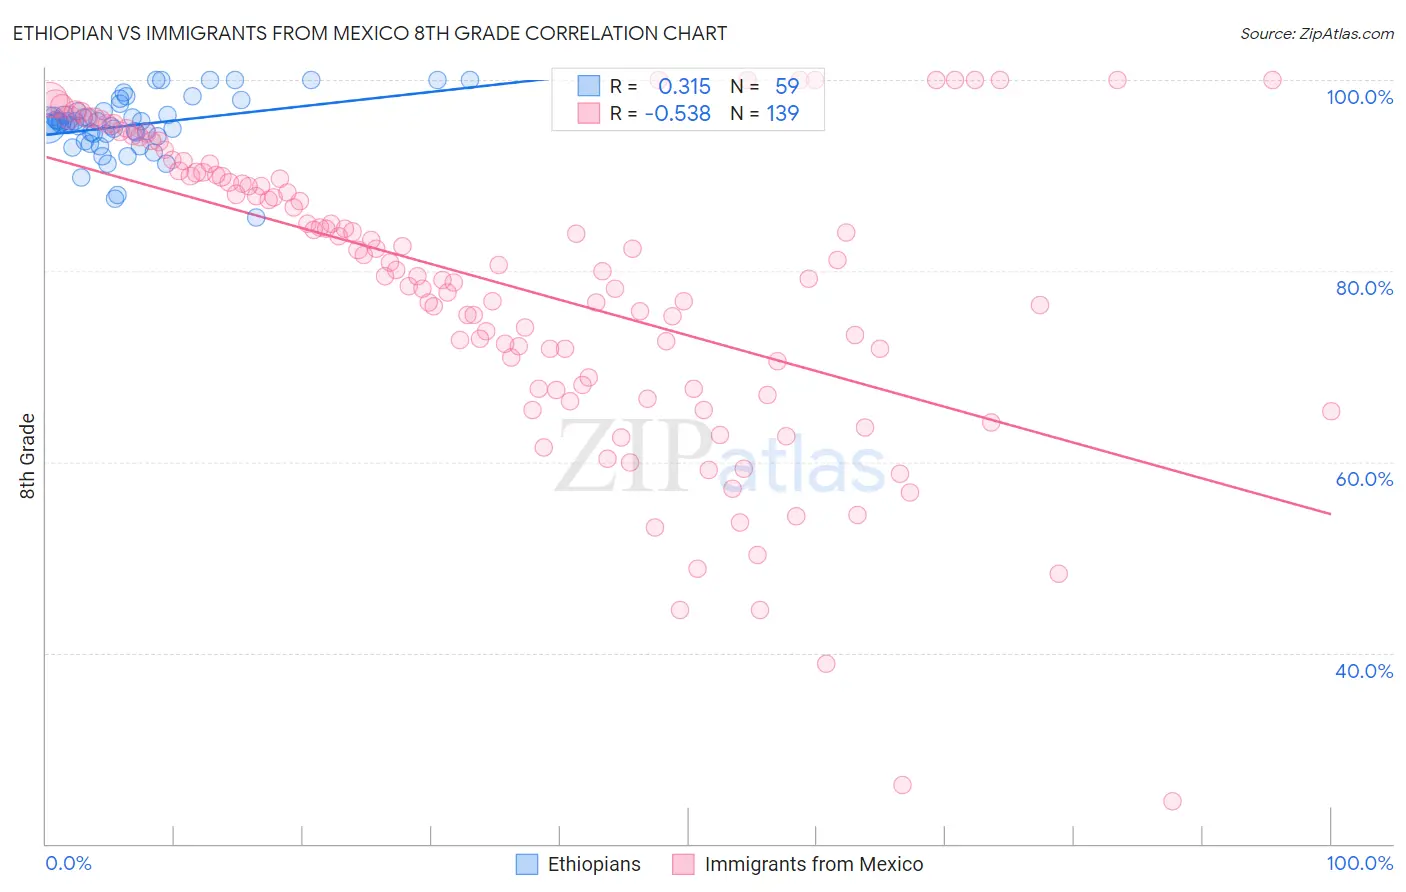
Ethiopian vs Immigrants from Mexico 8th Grade Correlation Chart
The statistical analysis conducted on geographies consisting of 223,135,094 people shows a mild positive correlation between the proportion of Ethiopians and percentage of population with at least 8th grade education in the United States with a correlation coefficient (R) of 0.315 and weighted average of 95.1%. Similarly, the statistical analysis conducted on geographies consisting of 513,767,012 people shows a substantial negative correlation between the proportion of Immigrants from Mexico and percentage of population with at least 8th grade education in the United States with a correlation coefficient (R) of -0.538 and weighted average of 90.2%, a difference of 5.5%.
8th Grade Correlation Summary
| Measurement | Ethiopian | Immigrants from Mexico |
| Minimum | 85.6% | 24.5% |
| Maximum | 100.0% | 100.0% |
| Range | 14.4% | 75.5% |
| Mean | 95.2% | 78.4% |
| Median | 95.3% | 80.1% |
| Interquartile 25% (IQ1) | 94.1% | 68.0% |
| Interquartile 75% (IQ3) | 96.7% | 90.3% |
| Interquartile Range (IQR) | 2.6% | 22.3% |
| Standard Deviation (Sample) | 3.1% | 15.7% |
| Standard Deviation (Population) | 3.0% | 15.6% |
Similar Demographics by 8th Grade
Demographics Similar to Ethiopians by 8th Grade
In terms of 8th grade, the demographic groups most similar to Ethiopians are Immigrants from Sierra Leone (95.1%, a difference of 0.0%), South American Indian (95.1%, a difference of 0.010%), Native/Alaskan (95.2%, a difference of 0.020%), Tongan (95.1%, a difference of 0.020%), and Paiute (95.1%, a difference of 0.030%).
| Demographics | Rating | Rank | 8th Grade |
| Immigrants | Asia | 3.1 /100 | #233 | Tragic 95.2% |
| Costa Ricans | 3.0 /100 | #234 | Tragic 95.2% |
| Nigerians | 2.9 /100 | #235 | Tragic 95.2% |
| Senegalese | 2.7 /100 | #236 | Tragic 95.2% |
| Immigrants | Africa | 2.7 /100 | #237 | Tragic 95.2% |
| Natives/Alaskans | 2.3 /100 | #238 | Tragic 95.2% |
| Immigrants | Sierra Leone | 2.1 /100 | #239 | Tragic 95.1% |
| Ethiopians | 2.0 /100 | #240 | Tragic 95.1% |
| South American Indians | 1.9 /100 | #241 | Tragic 95.1% |
| Tongans | 1.7 /100 | #242 | Tragic 95.1% |
| Paiute | 1.7 /100 | #243 | Tragic 95.1% |
| Immigrants | Middle Africa | 1.7 /100 | #244 | Tragic 95.1% |
| Jamaicans | 1.4 /100 | #245 | Tragic 95.1% |
| Somalis | 1.4 /100 | #246 | Tragic 95.1% |
| Immigrants | Senegal | 1.4 /100 | #247 | Tragic 95.1% |
Demographics Similar to Immigrants from Mexico by 8th Grade
In terms of 8th grade, the demographic groups most similar to Immigrants from Mexico are Immigrants from El Salvador (90.3%, a difference of 0.18%), Immigrants from Central America (90.4%, a difference of 0.27%), Spanish American Indian (89.8%, a difference of 0.44%), Immigrants from Guatemala (90.7%, a difference of 0.64%), and Salvadoran (90.9%, a difference of 0.81%).
| Demographics | Rating | Rank | 8th Grade |
| Hispanics or Latinos | 0.0 /100 | #333 | Tragic 92.2% |
| Immigrants | Yemen | 0.0 /100 | #334 | Tragic 92.1% |
| Mexican American Indians | 0.0 /100 | #335 | Tragic 92.1% |
| Immigrants | Honduras | 0.0 /100 | #336 | Tragic 91.9% |
| Immigrants | Latin America | 0.0 /100 | #337 | Tragic 91.7% |
| Central Americans | 0.0 /100 | #338 | Tragic 91.6% |
| Mexicans | 0.0 /100 | #339 | Tragic 91.4% |
| Yakama | 0.0 /100 | #340 | Tragic 91.2% |
| Guatemalans | 0.0 /100 | #341 | Tragic 91.1% |
| Salvadorans | 0.0 /100 | #342 | Tragic 90.9% |
| Immigrants | Guatemala | 0.0 /100 | #343 | Tragic 90.7% |
| Immigrants | Central America | 0.0 /100 | #344 | Tragic 90.4% |
| Immigrants | El Salvador | 0.0 /100 | #345 | Tragic 90.3% |
| Immigrants | Mexico | 0.0 /100 | #346 | Tragic 90.2% |
| Spanish American Indians | 0.0 /100 | #347 | Tragic 89.8% |