Ethiopian vs Argentinean Nursery School
COMPARE
Ethiopian
Argentinean
Nursery School
Nursery School Comparison
Ethiopians
Argentineans
97.6%
NURSERY SCHOOL
0.8/ 100
METRIC RATING
251st/ 347
METRIC RANK
98.0%
NURSERY SCHOOL
46.8/ 100
METRIC RATING
179th/ 347
METRIC RANK
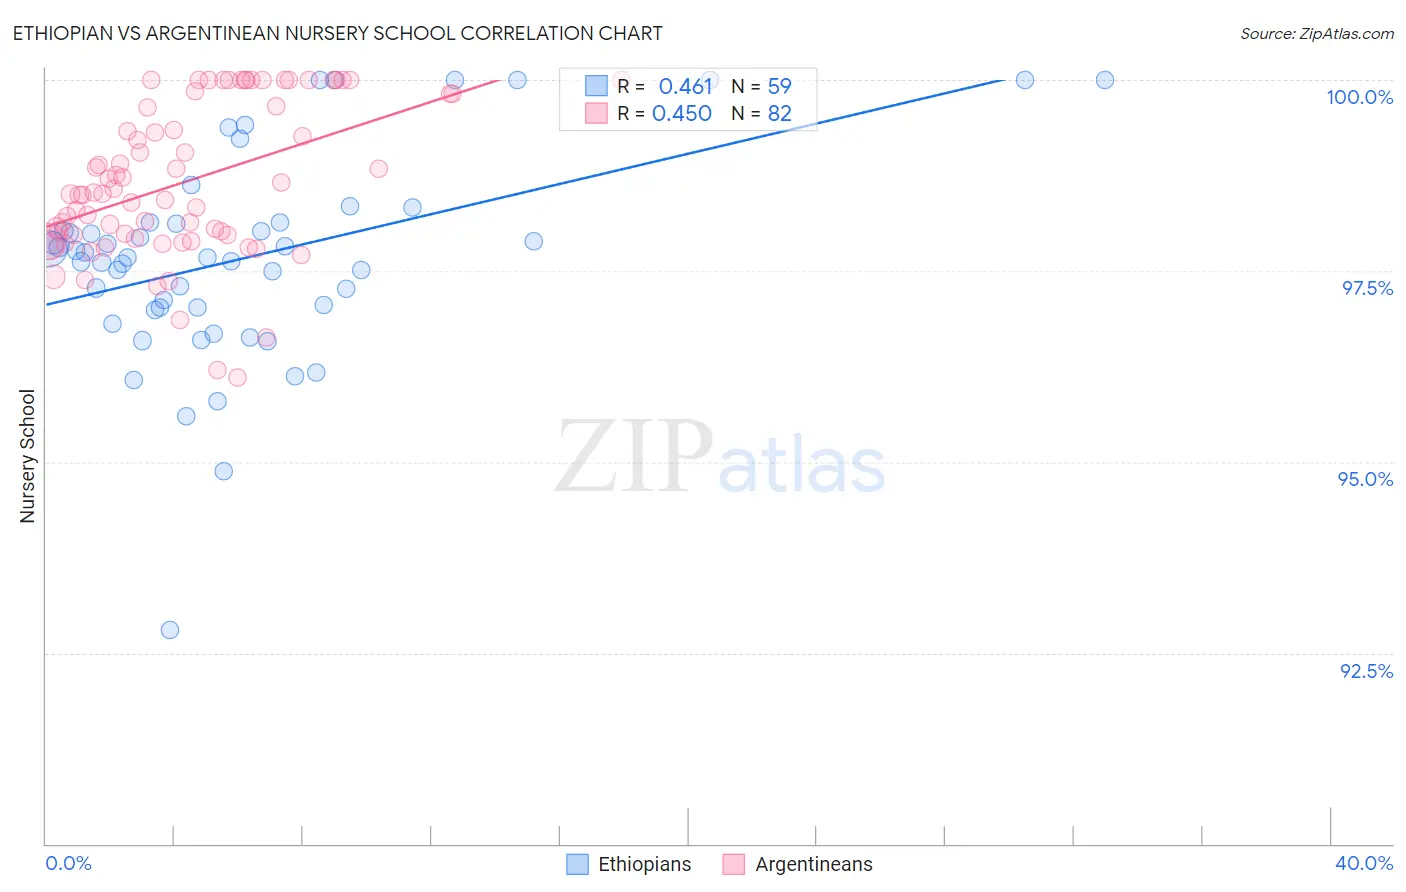
Ethiopian vs Argentinean Nursery School Correlation Chart
The statistical analysis conducted on geographies consisting of 223,220,814 people shows a moderate positive correlation between the proportion of Ethiopians and percentage of population with at least nursery school education in the United States with a correlation coefficient (R) of 0.461 and weighted average of 97.6%. Similarly, the statistical analysis conducted on geographies consisting of 297,146,811 people shows a moderate positive correlation between the proportion of Argentineans and percentage of population with at least nursery school education in the United States with a correlation coefficient (R) of 0.450 and weighted average of 98.0%, a difference of 0.35%.
Nursery School Correlation Summary
| Measurement | Ethiopian | Argentinean |
| Minimum | 92.8% | 96.1% |
| Maximum | 100.0% | 100.0% |
| Range | 7.2% | 3.9% |
| Mean | 97.7% | 98.7% |
| Median | 97.7% | 98.5% |
| Interquartile 25% (IQ1) | 97.0% | 98.0% |
| Interquartile 75% (IQ3) | 98.1% | 99.8% |
| Interquartile Range (IQR) | 1.1% | 1.8% |
| Standard Deviation (Sample) | 1.3% | 1.00% |
| Standard Deviation (Population) | 1.3% | 0.99% |
Similar Demographics by Nursery School
Demographics Similar to Ethiopians by Nursery School
In terms of nursery school, the demographic groups most similar to Ethiopians are Immigrants from Africa (97.6%, a difference of 0.0%), Peruvian (97.6%, a difference of 0.010%), Immigrants from Middle Africa (97.6%, a difference of 0.010%), Indian (Asian) (97.6%, a difference of 0.010%), and Immigrants from Eastern Africa (97.6%, a difference of 0.010%).
| Demographics | Rating | Rank | Nursery School |
| South Americans | 1.0 /100 | #244 | Tragic 97.6% |
| Bolivians | 1.0 /100 | #245 | Tragic 97.6% |
| Peruvians | 1.0 /100 | #246 | Tragic 97.6% |
| Immigrants | Middle Africa | 0.9 /100 | #247 | Tragic 97.6% |
| Indians (Asian) | 0.9 /100 | #248 | Tragic 97.6% |
| Immigrants | Eastern Africa | 0.9 /100 | #249 | Tragic 97.6% |
| Immigrants | Senegal | 0.9 /100 | #250 | Tragic 97.6% |
| Ethiopians | 0.8 /100 | #251 | Tragic 97.6% |
| Immigrants | Africa | 0.8 /100 | #252 | Tragic 97.6% |
| Immigrants | Iraq | 0.7 /100 | #253 | Tragic 97.6% |
| Immigrants | Congo | 0.7 /100 | #254 | Tragic 97.6% |
| Immigrants | Asia | 0.7 /100 | #255 | Tragic 97.6% |
| Yaqui | 0.6 /100 | #256 | Tragic 97.6% |
| Immigrants | Colombia | 0.6 /100 | #257 | Tragic 97.6% |
| Jamaicans | 0.6 /100 | #258 | Tragic 97.6% |
Demographics Similar to Argentineans by Nursery School
In terms of nursery school, the demographic groups most similar to Argentineans are Immigrants from Bosnia and Herzegovina (98.0%, a difference of 0.0%), Immigrants from Brazil (98.0%, a difference of 0.010%), Kenyan (98.0%, a difference of 0.010%), Navajo (98.0%, a difference of 0.010%), and Immigrants from Sri Lanka (98.0%, a difference of 0.010%).
| Demographics | Rating | Rank | Nursery School |
| Immigrants | Brazil | 51.3 /100 | #172 | Average 98.0% |
| Kenyans | 50.2 /100 | #173 | Average 98.0% |
| Navajo | 50.0 /100 | #174 | Average 98.0% |
| Immigrants | Sri Lanka | 49.9 /100 | #175 | Average 98.0% |
| Immigrants | Venezuela | 49.8 /100 | #176 | Average 98.0% |
| Albanians | 48.9 /100 | #177 | Average 98.0% |
| Natives/Alaskans | 48.6 /100 | #178 | Average 98.0% |
| Argentineans | 46.8 /100 | #179 | Average 98.0% |
| Immigrants | Bosnia and Herzegovina | 45.6 /100 | #180 | Average 98.0% |
| Egyptians | 42.8 /100 | #181 | Average 98.0% |
| Paiute | 42.0 /100 | #182 | Average 98.0% |
| Portuguese | 41.8 /100 | #183 | Average 98.0% |
| Immigrants | Poland | 41.3 /100 | #184 | Average 98.0% |
| Immigrants | Belarus | 41.0 /100 | #185 | Average 98.0% |
| Immigrants | Argentina | 40.8 /100 | #186 | Average 98.0% |