Estonian vs Delaware High School Diploma
COMPARE
Estonian
Delaware
High School Diploma
High School Diploma Comparison
Estonians
Delaware
91.6%
HIGH SCHOOL DIPLOMA
99.9/ 100
METRIC RATING
22nd/ 347
METRIC RANK
89.2%
HIGH SCHOOL DIPLOMA
55.8/ 100
METRIC RATING
168th/ 347
METRIC RANK
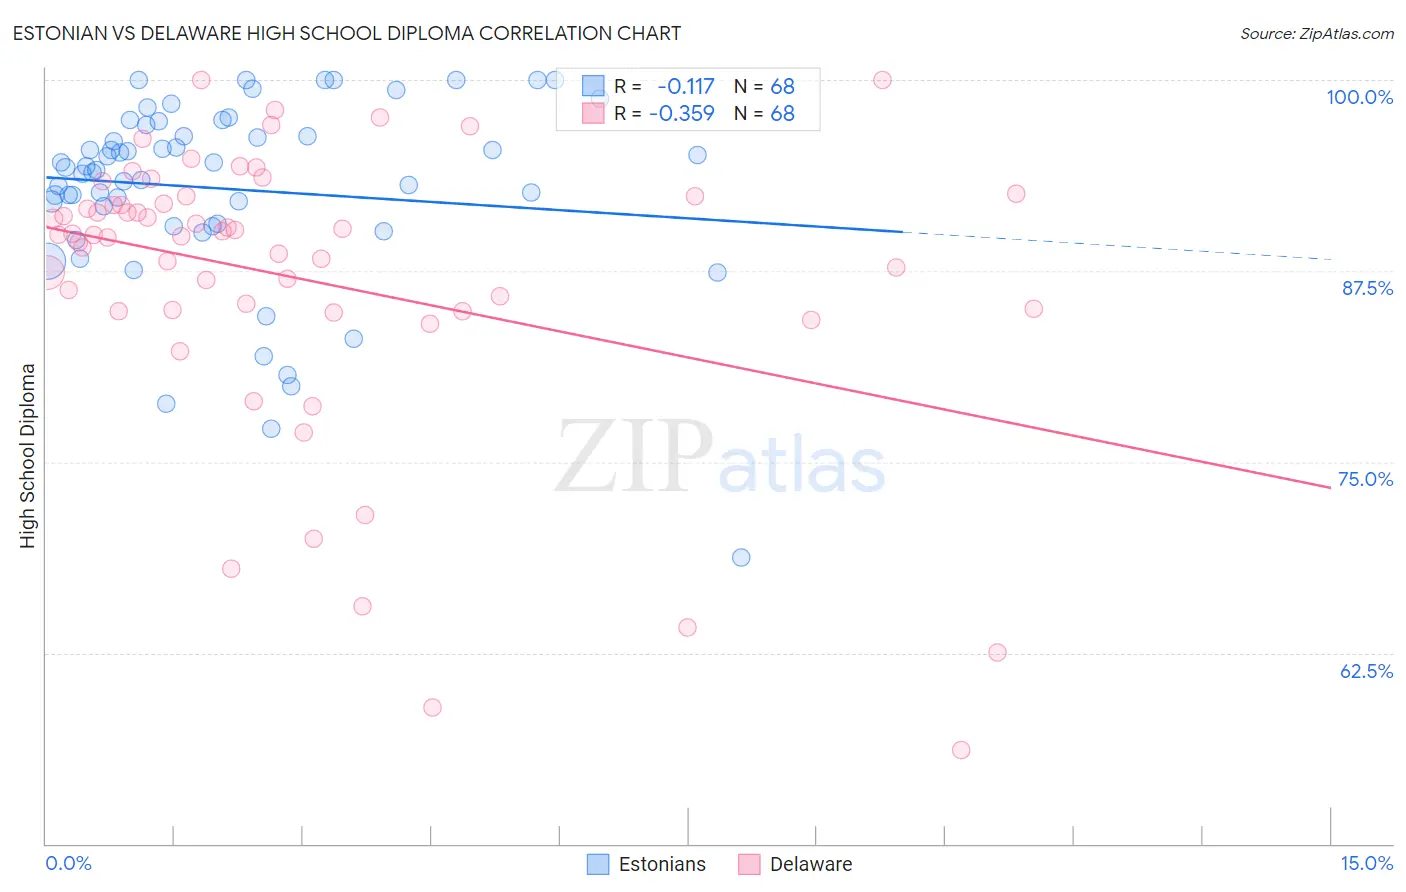
Estonian vs Delaware High School Diploma Correlation Chart
The statistical analysis conducted on geographies consisting of 123,527,724 people shows a poor negative correlation between the proportion of Estonians and percentage of population with at least high school diploma education in the United States with a correlation coefficient (R) of -0.117 and weighted average of 91.6%. Similarly, the statistical analysis conducted on geographies consisting of 96,235,398 people shows a mild negative correlation between the proportion of Delaware and percentage of population with at least high school diploma education in the United States with a correlation coefficient (R) of -0.359 and weighted average of 89.2%, a difference of 2.6%.
High School Diploma Correlation Summary
| Measurement | Estonian | Delaware |
| Minimum | 68.8% | 56.1% |
| Maximum | 100.0% | 100.0% |
| Range | 31.2% | 43.9% |
| Mean | 92.9% | 86.9% |
| Median | 94.2% | 89.9% |
| Interquartile 25% (IQ1) | 90.5% | 84.9% |
| Interquartile 75% (IQ3) | 96.7% | 92.2% |
| Interquartile Range (IQR) | 6.2% | 7.2% |
| Standard Deviation (Sample) | 6.1% | 9.5% |
| Standard Deviation (Population) | 6.1% | 9.5% |
Similar Demographics by High School Diploma
Demographics Similar to Estonians by High School Diploma
In terms of high school diploma, the demographic groups most similar to Estonians are Filipino (91.6%, a difference of 0.010%), Czech (91.6%, a difference of 0.020%), Scandinavian (91.5%, a difference of 0.030%), Italian (91.5%, a difference of 0.030%), and Thai (91.5%, a difference of 0.030%).
| Demographics | Rating | Rank | High School Diploma |
| Luxembourgers | 100.0 /100 | #15 | Exceptional 91.7% |
| Finns | 100.0 /100 | #16 | Exceptional 91.7% |
| Immigrants | Singapore | 99.9 /100 | #17 | Exceptional 91.7% |
| Germans | 99.9 /100 | #18 | Exceptional 91.7% |
| Maltese | 99.9 /100 | #19 | Exceptional 91.6% |
| Czechs | 99.9 /100 | #20 | Exceptional 91.6% |
| Filipinos | 99.9 /100 | #21 | Exceptional 91.6% |
| Estonians | 99.9 /100 | #22 | Exceptional 91.6% |
| Scandinavians | 99.9 /100 | #23 | Exceptional 91.5% |
| Italians | 99.9 /100 | #24 | Exceptional 91.5% |
| Thais | 99.9 /100 | #25 | Exceptional 91.5% |
| Russians | 99.9 /100 | #26 | Exceptional 91.5% |
| Cypriots | 99.9 /100 | #27 | Exceptional 91.5% |
| Tlingit-Haida | 99.9 /100 | #28 | Exceptional 91.4% |
| Europeans | 99.9 /100 | #29 | Exceptional 91.4% |
Demographics Similar to Delaware by High School Diploma
In terms of high school diploma, the demographic groups most similar to Delaware are Iroquois (89.2%, a difference of 0.010%), Immigrants from Hong Kong (89.3%, a difference of 0.040%), Immigrants from Morocco (89.2%, a difference of 0.040%), Spanish (89.2%, a difference of 0.040%), and Immigrants from Asia (89.3%, a difference of 0.060%).
| Demographics | Rating | Rank | High School Diploma |
| Brazilians | 61.2 /100 | #161 | Good 89.3% |
| Bermudans | 61.1 /100 | #162 | Good 89.3% |
| Cree | 61.1 /100 | #163 | Good 89.3% |
| Immigrants | Nepal | 61.1 /100 | #164 | Good 89.3% |
| Immigrants | Asia | 59.8 /100 | #165 | Average 89.3% |
| Immigrants | Albania | 59.4 /100 | #166 | Average 89.3% |
| Immigrants | Hong Kong | 58.6 /100 | #167 | Average 89.3% |
| Delaware | 55.8 /100 | #168 | Average 89.2% |
| Iroquois | 55.1 /100 | #169 | Average 89.2% |
| Immigrants | Morocco | 53.3 /100 | #170 | Average 89.2% |
| Spanish | 52.9 /100 | #171 | Average 89.2% |
| Immigrants | Nonimmigrants | 51.8 /100 | #172 | Average 89.2% |
| Immigrants | Indonesia | 50.3 /100 | #173 | Average 89.1% |
| Hmong | 50.0 /100 | #174 | Average 89.1% |
| Immigrants | Western Asia | 49.0 /100 | #175 | Average 89.1% |