Egyptian vs Okinawan 8th Grade

COMPARE

Egyptian
Race
Ancestry
AfghanAfricanAlaska NativeAlaskan AthabascanAlbanianAleutAlsatianAmericanApacheArabArapahoArgentineanArmenianAssyrian/Chaldean/SyriacAustralianAustrianBahamianBangladeshiBarbadianBasqueBelgianBelizeanBermudanBhutaneseBlackfeetBolivianBrazilianBritishBritish West IndianBulgarianBurmeseCajunCambodianCanadianCape VerdeanCarpatho RusynCelticCentral AmericanCentral American IndianCherokeeCheyenneChickasawChileanChineseChippewaChoctawColombianColvilleComancheCosta RicanCreeCreekCroatianCrowCubanCypriotCzechCzechoslovakianDanishDelawareDominicanDutchDutch West IndianEastern EuropeanEcuadorianEgyptianEnglishEstonianEthiopianEuropeanFijianFilipinoFinnishFrenchFrench American IndianFrench CanadianGermanGerman RussianGhanaianGreekGuamanian/ChamorroGuatemalanGuyaneseHaitianHmongHonduranHopiHoumaHungarianIcelanderIndian (Asian)IndonesianInupiatIranianIraqiIrishIroquoisIsraeliItalianJamaicanJapaneseJordanianKenyanKiowaKoreanLaotianLatvianLebaneseLiberianLithuanianLumbeeLuxembourgerMacedonianMalaysianMalteseMarshalleseMenomineeMexicanMexican American IndianMongolianMoroccanNative HawaiianNavajoNepaleseNew ZealanderNicaraguanNigerianNorthern EuropeanNorwegianOsageOttawaPaiutePakistaniPalestinianPanamanianParaguayanPennsylvania GermanPeruvianPimaPolishPortuguesePotawatomiPuebloPuerto RicanPuget Sound SalishRomanianRussianSalvadoranSamoanScandinavianScotch-IrishScottishSeminoleSenegaleseSerbianShoshoneSierra LeoneanSiouxSlavicSlovakSloveneSomaliSouth AfricanSouth AmericanSouth American IndianSoviet UnionSpaniardSpanishSpanish AmericanSpanish American IndianSri LankanSubsaharan AfricanSudaneseSwedishSwissSyrianTaiwaneseThaiTlingit-HaidaTohono O'OdhamTonganTrinidadian and TobagonianTsimshianTurkishU.S. Virgin IslanderUgandanUkrainianUruguayanUteVenezuelanVietnameseWelshWest IndianYakamaYaquiYugoslavianYumanYup'ikZimbabwean
Immigration
NonimmigrantsImmigrantsAfghanistanAfricaAlbaniaArgentinaArmeniaAsiaAustraliaAustriaBahamasBangladeshBarbadosBelarusBelgiumBelizeBoliviaBosnia and HerzegovinaBrazilBulgariaBurma/MyanmarCabo VerdeCambodiaCameroonCanadaCaribbeanCentral AmericaChileChinaColombiaCongoCosta RicaCroatiaCubaCzechoslovakiaDenmarkDominicaDominican RepublicEastern AfricaEastern AsiaEastern EuropeEcuadorEgyptEl SalvadorEnglandEritreaEthiopiaEuropeFijiFranceGermanyGhanaGreeceGrenadaGuatemalaGuyanaHaitiHondurasHong KongHungaryIndiaIndonesiaIranIraqIrelandIsraelItalyJamaicaJapanJordanKazakhstanKenyaKoreaKuwaitLaosLatin AmericaLatviaLebanonLiberiaLithuaniaMalaysiaMexicoMicronesiaMiddle AfricaMoldovaMoroccoNepalNetherlandsNicaraguaNigeriaNorth AmericaNorth MacedoniaNorthern AfricaNorthern EuropeNorwayOceaniaPakistanPanamaPeruPhilippinesPolandPortugalRomaniaRussiaSaudi ArabiaScotlandSenegalSerbiaSierra LeoneSingaporeSomaliaSouth AfricaSouth AmericaSouth Central AsiaSouth Eastern AsiaSouthern EuropeSpainSri LankaSt. Vincent and the GrenadinesSudanSwedenSwitzerlandSyriaTaiwanThailandTrinidad and TobagoTurkeyUgandaUkraineUruguayUzbekistanVenezuelaVietnamWest IndiesWestern AfricaWestern AsiaWestern EuropeYemenZaireZimbabweAzores
Okinawan
Race
Ancestry
AfghanAfricanAlaska NativeAlaskan AthabascanAlbanianAleutAlsatianAmericanApacheArabArapahoArgentineanArmenianAssyrian/Chaldean/SyriacAustralianAustrianBahamianBangladeshiBarbadianBasqueBelgianBelizeanBermudanBhutaneseBlackfeetBolivianBrazilianBritishBritish West IndianBulgarianBurmeseCajunCambodianCanadianCape VerdeanCarpatho RusynCelticCentral AmericanCentral American IndianCherokeeCheyenneChickasawChileanChineseChippewaChoctawColombianColvilleComancheCosta RicanCreeCreekCroatianCrowCubanCypriotCzechCzechoslovakianDanishDelawareDominicanDutchDutch West IndianEastern EuropeanEcuadorianEnglishEstonianEthiopianEuropeanFijianFilipinoFinnishFrenchFrench American IndianFrench CanadianGermanGerman RussianGhanaianGreekGuamanian/ChamorroGuatemalanGuyaneseHaitianHmongHonduranHopiHoumaHungarianIcelanderIndian (Asian)IndonesianInupiatIranianIraqiIrishIroquoisIsraeliItalianJamaicanJapaneseJordanianKenyanKiowaKoreanLaotianLatvianLebaneseLiberianLithuanianLumbeeLuxembourgerMacedonianMalaysianMalteseMarshalleseMenomineeMexicanMexican American IndianMongolianMoroccanNative HawaiianNavajoNepaleseNew ZealanderNicaraguanNigerianNorthern EuropeanNorwegianOkinawanOsageOttawaPaiutePakistaniPalestinianPanamanianParaguayanPennsylvania GermanPeruvianPimaPolishPortuguesePotawatomiPuebloPuerto RicanPuget Sound SalishRomanianRussianSalvadoranSamoanScandinavianScotch-IrishScottishSeminoleSenegaleseSerbianShoshoneSierra LeoneanSiouxSlavicSlovakSloveneSomaliSouth AfricanSouth AmericanSouth American IndianSoviet UnionSpaniardSpanishSpanish AmericanSpanish American IndianSri LankanSubsaharan AfricanSudaneseSwedishSwissSyrianTaiwaneseThaiTlingit-HaidaTohono O'OdhamTonganTrinidadian and TobagonianTsimshianTurkishU.S. Virgin IslanderUgandanUkrainianUruguayanUteVenezuelanVietnameseWelshWest IndianYakamaYaquiYugoslavianYumanYup'ikZimbabwean
Immigration
NonimmigrantsImmigrantsAfghanistanAfricaAlbaniaArgentinaArmeniaAsiaAustraliaAustriaBahamasBangladeshBarbadosBelarusBelgiumBelizeBoliviaBosnia and HerzegovinaBrazilBulgariaBurma/MyanmarCabo VerdeCambodiaCameroonCanadaCaribbeanCentral AmericaChileChinaColombiaCongoCosta RicaCroatiaCubaCzechoslovakiaDenmarkDominicaDominican RepublicEastern AfricaEastern AsiaEastern EuropeEcuadorEgyptEl SalvadorEnglandEritreaEthiopiaEuropeFijiFranceGermanyGhanaGreeceGrenadaGuatemalaGuyanaHaitiHondurasHong KongHungaryIndiaIndonesiaIranIraqIrelandIsraelItalyJamaicaJapanJordanKazakhstanKenyaKoreaKuwaitLaosLatin AmericaLatviaLebanonLiberiaLithuaniaMalaysiaMexicoMicronesiaMiddle AfricaMoldovaMoroccoNepalNetherlandsNicaraguaNigeriaNorth AmericaNorth MacedoniaNorthern AfricaNorthern EuropeNorwayOceaniaPakistanPanamaPeruPhilippinesPolandPortugalRomaniaRussiaSaudi ArabiaScotlandSenegalSerbiaSierra LeoneSingaporeSomaliaSouth AfricaSouth AmericaSouth Central AsiaSouth Eastern AsiaSouthern EuropeSpainSri LankaSt. Vincent and the GrenadinesSudanSwedenSwitzerlandSyriaTaiwanThailandTrinidad and TobagoTurkeyUgandaUkraineUruguayUzbekistanVenezuelaVietnamWest IndiesWestern AfricaWestern AsiaWestern EuropeYemenZaireZimbabweAzores
8th Grade
Income
Poverty
Unemployment
Labor Participation
Family Structure
Vehicle Availability
Education Level
Disability

8th Grade Comparison

Egyptians

Okinawans

Average
Exceptional
95.8%
8TH GRADE
58.2/ 100
METRIC RATING
171st/ 347
METRIC RANK
96.3%
8TH GRADE
98.0/ 100
METRIC RATING
106th/ 347
METRIC RANK

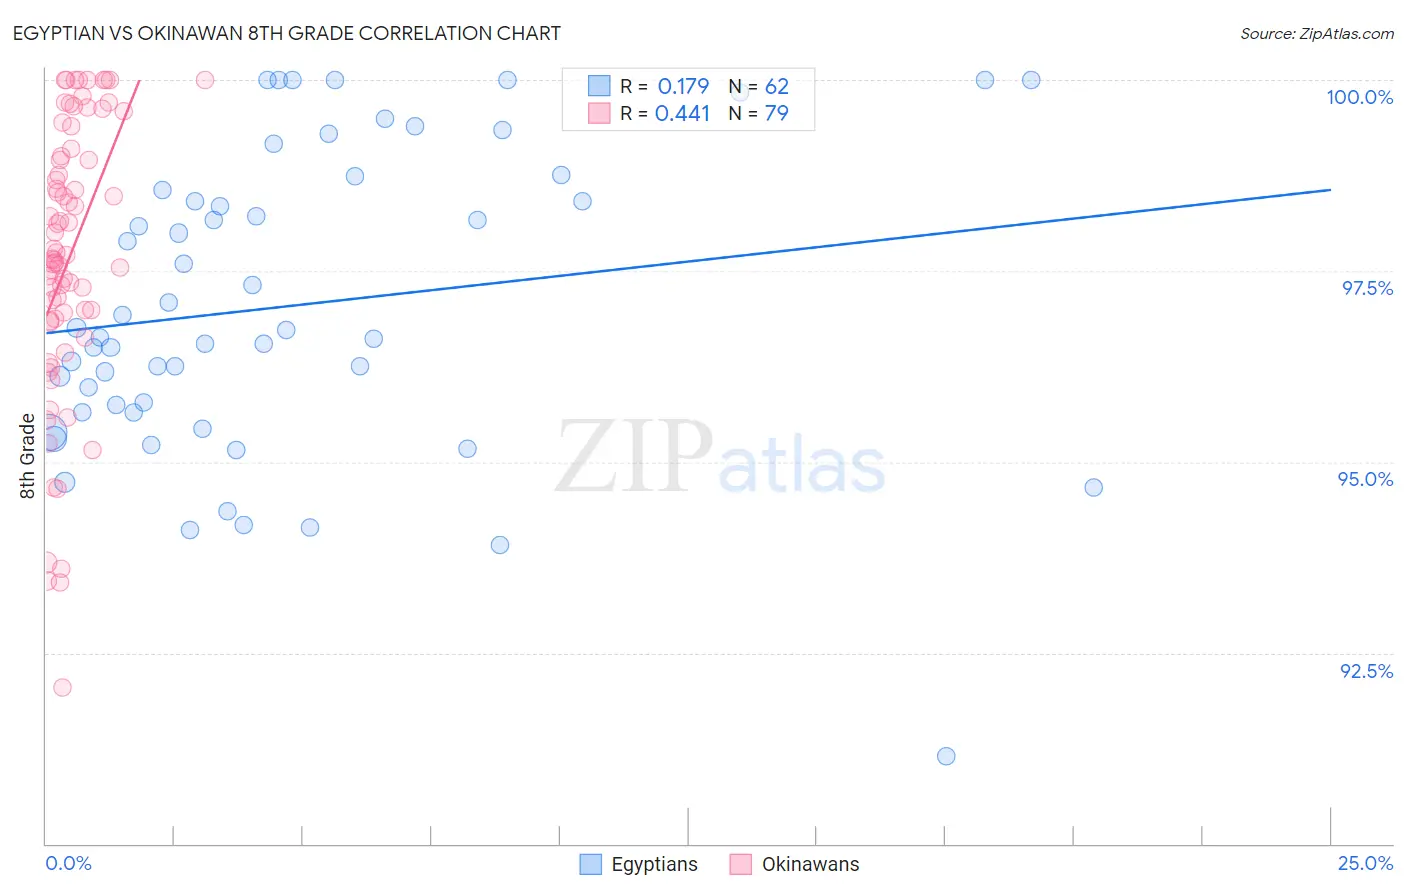
Egyptian vs Okinawan 8th Grade Correlation Chart

The statistical analysis conducted on geographies consisting of 276,927,423 people shows a poor positive correlation between the proportion of Egyptians and percentage of population with at least 8th grade education in the United States with a correlation coefficient (R) of 0.179 and weighted average of 95.8%. Similarly, the statistical analysis conducted on geographies consisting of 73,779,368 people shows a moderate positive correlation between the proportion of Okinawans and percentage of population with at least 8th grade education in the United States with a correlation coefficient (R) of 0.441 and weighted average of 96.3%, a difference of 0.57%.
Egyptian vs Okinawan 8th Grade

8th Grade Correlation Summary

MeasurementEgyptianOkinawan
Minimum91.1%92.0%
Maximum100.0%100.0%
Range8.9%8.0%
Mean97.0%97.7%
Median96.7%97.7%
Interquartile 25% (IQ1)95.7%96.9%
Interquartile 75% (IQ3)98.6%99.1%
Interquartile Range (IQR)2.9%2.2%
Standard Deviation (Sample)2.0%1.8%
Standard Deviation (Population)2.0%1.8%

Similar Demographics by 8th Grade

Demographics Similar to Egyptians by 8th Grade

In terms of 8th grade, the demographic groups most similar to Egyptians are Immigrants from Iran (95.8%, a difference of 0.0%), Ute (95.8%, a difference of 0.0%), Immigrants from Korea (95.8%, a difference of 0.0%), Spaniard (95.8%, a difference of 0.010%), and Immigrants from Ukraine (95.8%, a difference of 0.010%).
DemographicsRating | Rank8th Grade
Immigrants | Italy
63.5
/100
|
#164
Good
95.8%
Alsatians
61.4
/100
|
#165
Good
95.8%
Immigrants | Poland
61.1
/100
|
#166
Good
95.8%
Spaniards
60.0
/100
|
#167
Good
95.8%
Immigrants | Ukraine
59.5
/100
|
#168
Average
95.8%
Immigrants | Iran
58.6
/100
|
#169
Average
95.8%
Ute
58.5
/100
|
#170
Average
95.8%
Egyptians
58.2
/100
|
#171
Average
95.8%
Immigrants | Korea
57.9
/100
|
#172
Average
95.8%
Mongolians
53.0
/100
|
#173
Average
95.8%
Chileans
50.0
/100
|
#174
Average
95.7%
Immigrants | Albania
49.6
/100
|
#175
Average
95.7%
Pakistanis
48.8
/100
|
#176
Average
95.7%
Marshallese
47.6
/100
|
#177
Average
95.7%
Venezuelans
47.5
/100
|
#178
Average
95.7%

Demographics Similar to Okinawans by 8th Grade

In terms of 8th grade, the demographic groups most similar to Okinawans are Immigrants from Saudi Arabia (96.3%, a difference of 0.0%), Kiowa (96.3%, a difference of 0.0%), Immigrants from North Macedonia (96.3%, a difference of 0.0%), Immigrants from Latvia (96.3%, a difference of 0.010%), and Bhutanese (96.4%, a difference of 0.020%).
DemographicsRating | Rank8th Grade
Cree
98.6
/100
|
#99
Exceptional
96.4%
Immigrants | Czechoslovakia
98.6
/100
|
#100
Exceptional
96.4%
Bhutanese
98.2
/100
|
#101
Exceptional
96.4%
South Africans
98.2
/100
|
#102
Exceptional
96.4%
Immigrants | Saudi Arabia
98.0
/100
|
#103
Exceptional
96.3%
Kiowa
98.0
/100
|
#104
Exceptional
96.3%
Immigrants | North Macedonia
98.0
/100
|
#105
Exceptional
96.3%
Okinawans
98.0
/100
|
#106
Exceptional
96.3%
Immigrants | Latvia
97.8
/100
|
#107
Exceptional
96.3%
Lebanese
97.5
/100
|
#108
Exceptional
96.3%
Iroquois
97.5
/100
|
#109
Exceptional
96.3%
Cajuns
97.1
/100
|
#110
Exceptional
96.3%
Shoshone
96.8
/100
|
#111
Exceptional
96.3%
Syrians
96.7
/100
|
#112
Exceptional
96.3%
Immigrants | Zimbabwe
96.7
/100
|
#113
Exceptional
96.3%