Egyptian vs Immigrants from Czechoslovakia Bachelor's Degree
COMPARE
Egyptian
Immigrants from Czechoslovakia
Bachelor's Degree
Bachelor's Degree Comparison
Egyptians
Immigrants from Czechoslovakia
43.3%
BACHELOR'S DEGREE
99.7/ 100
METRIC RATING
67th/ 347
METRIC RANK
44.0%
BACHELOR'S DEGREE
99.9/ 100
METRIC RATING
58th/ 347
METRIC RANK
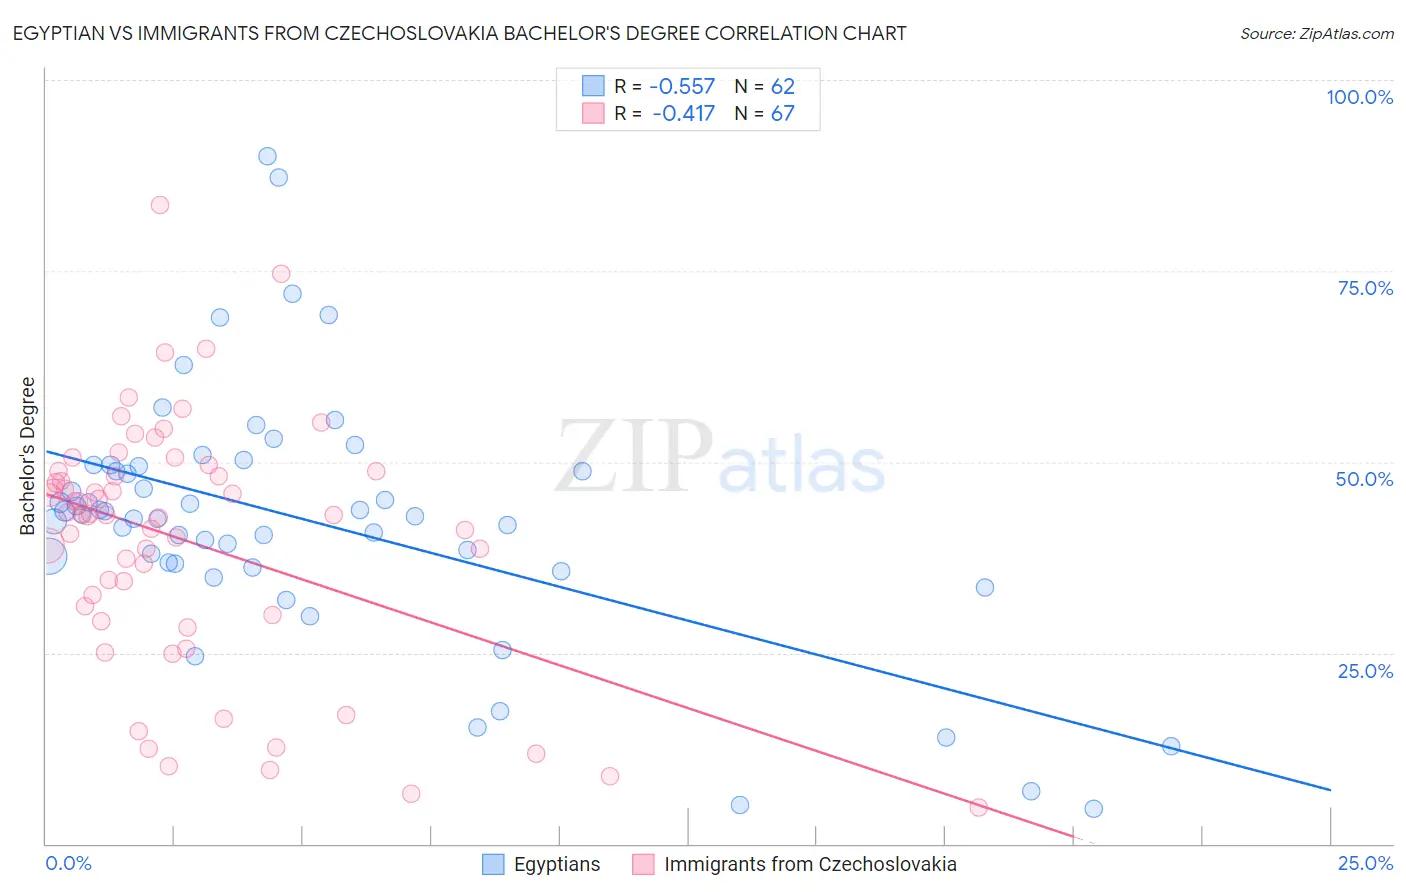
Egyptian vs Immigrants from Czechoslovakia Bachelor's Degree Correlation Chart
The statistical analysis conducted on geographies consisting of 276,908,448 people shows a substantial negative correlation between the proportion of Egyptians and percentage of population with at least bachelor's degree education in the United States with a correlation coefficient (R) of -0.557 and weighted average of 43.3%. Similarly, the statistical analysis conducted on geographies consisting of 195,448,477 people shows a moderate negative correlation between the proportion of Immigrants from Czechoslovakia and percentage of population with at least bachelor's degree education in the United States with a correlation coefficient (R) of -0.417 and weighted average of 44.0%, a difference of 1.7%.
Bachelor's Degree Correlation Summary
| Measurement | Egyptian | Immigrants from Czechoslovakia |
| Minimum | 4.6% | 4.8% |
| Maximum | 90.0% | 83.6% |
| Range | 85.4% | 78.9% |
| Mean | 42.3% | 39.6% |
| Median | 43.0% | 43.1% |
| Interquartile 25% (IQ1) | 36.6% | 29.9% |
| Interquartile 75% (IQ3) | 49.5% | 48.7% |
| Interquartile Range (IQR) | 12.8% | 18.8% |
| Standard Deviation (Sample) | 16.5% | 16.3% |
| Standard Deviation (Population) | 16.3% | 16.2% |
Demographics Similar to Egyptians and Immigrants from Czechoslovakia by Bachelor's Degree
In terms of bachelor's degree, the demographic groups most similar to Egyptians are Immigrants from Netherlands (43.3%, a difference of 0.020%), Immigrants from Indonesia (43.3%, a difference of 0.020%), Zimbabwean (43.3%, a difference of 0.040%), Argentinean (43.3%, a difference of 0.050%), and Immigrants from Pakistan (43.1%, a difference of 0.28%). Similarly, the demographic groups most similar to Immigrants from Czechoslovakia are Paraguayan (44.0%, a difference of 0.050%), Australian (44.0%, a difference of 0.10%), New Zealander (44.0%, a difference of 0.11%), Immigrants from Serbia (44.1%, a difference of 0.24%), and Immigrants from Bolivia (44.2%, a difference of 0.42%).
| Demographics | Rating | Rank | Bachelor's Degree |
| Immigrants | Spain | 99.9 /100 | #52 | Exceptional 44.3% |
| Immigrants | Asia | 99.9 /100 | #53 | Exceptional 44.3% |
| Immigrants | Austria | 99.9 /100 | #54 | Exceptional 44.2% |
| Immigrants | Bolivia | 99.9 /100 | #55 | Exceptional 44.2% |
| Immigrants | Serbia | 99.9 /100 | #56 | Exceptional 44.1% |
| Paraguayans | 99.9 /100 | #57 | Exceptional 44.0% |
| Immigrants | Czechoslovakia | 99.9 /100 | #58 | Exceptional 44.0% |
| Australians | 99.9 /100 | #59 | Exceptional 44.0% |
| New Zealanders | 99.9 /100 | #60 | Exceptional 44.0% |
| South Africans | 99.8 /100 | #61 | Exceptional 43.6% |
| Immigrants | Kazakhstan | 99.8 /100 | #62 | Exceptional 43.4% |
| Immigrants | Europe | 99.8 /100 | #63 | Exceptional 43.4% |
| Argentineans | 99.7 /100 | #64 | Exceptional 43.3% |
| Zimbabweans | 99.7 /100 | #65 | Exceptional 43.3% |
| Immigrants | Netherlands | 99.7 /100 | #66 | Exceptional 43.3% |
| Egyptians | 99.7 /100 | #67 | Exceptional 43.3% |
| Immigrants | Indonesia | 99.7 /100 | #68 | Exceptional 43.3% |
| Immigrants | Pakistan | 99.7 /100 | #69 | Exceptional 43.1% |
| Immigrants | Romania | 99.6 /100 | #70 | Exceptional 42.9% |
| Immigrants | Argentina | 99.6 /100 | #71 | Exceptional 42.8% |
| Ethiopians | 99.5 /100 | #72 | Exceptional 42.8% |