Ecuadorian vs Immigrants from Sudan Bachelor's Degree
COMPARE
Ecuadorian
Immigrants from Sudan
Bachelor's Degree
Bachelor's Degree Comparison
Ecuadorians
Immigrants from Sudan
35.4%
BACHELOR'S DEGREE
6.6/ 100
METRIC RATING
227th/ 347
METRIC RANK
39.4%
BACHELOR'S DEGREE
84.5/ 100
METRIC RATING
139th/ 347
METRIC RANK
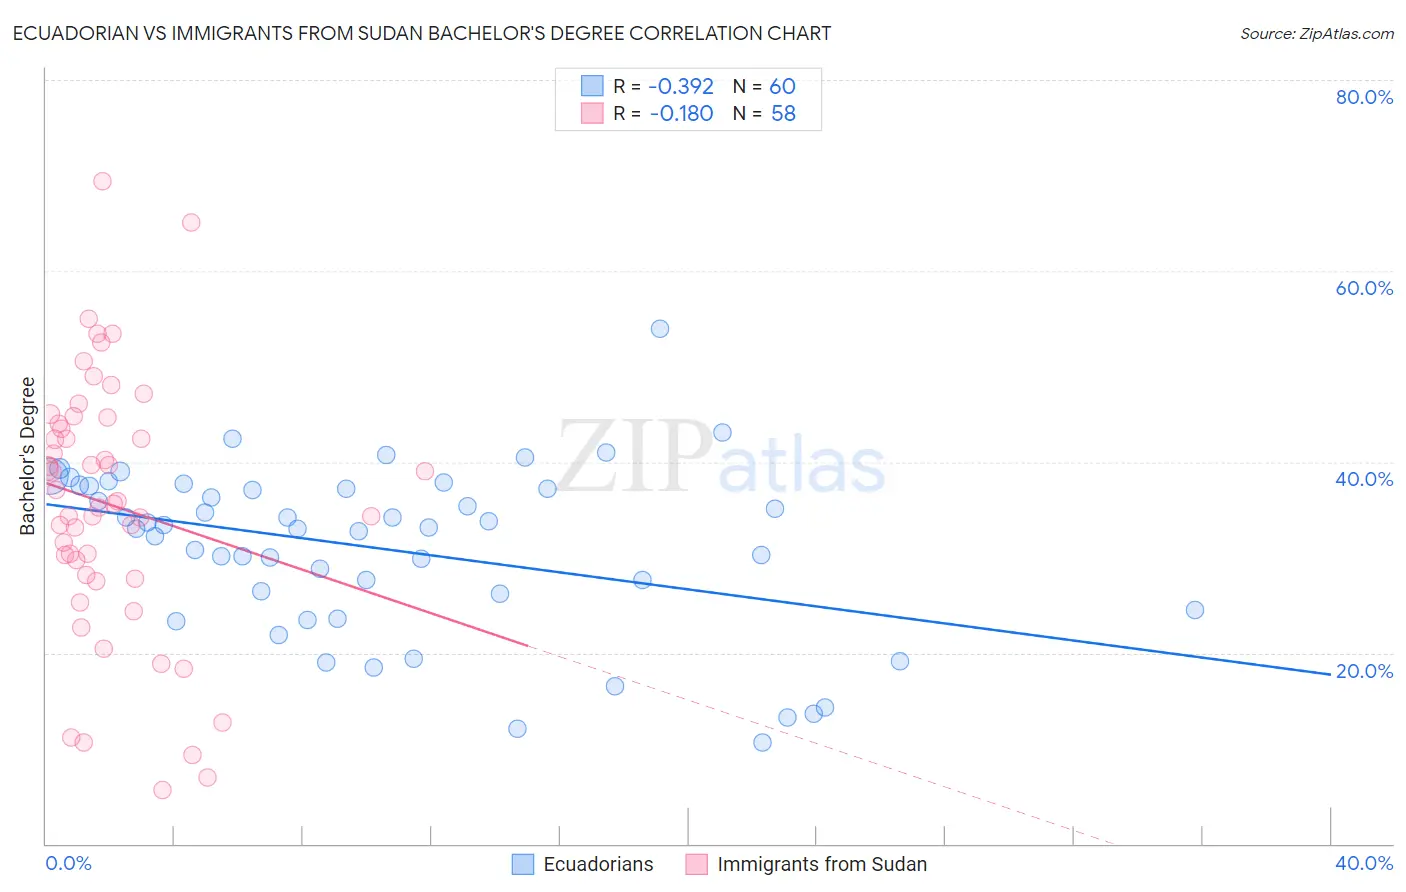
Ecuadorian vs Immigrants from Sudan Bachelor's Degree Correlation Chart
The statistical analysis conducted on geographies consisting of 317,830,457 people shows a mild negative correlation between the proportion of Ecuadorians and percentage of population with at least bachelor's degree education in the United States with a correlation coefficient (R) of -0.392 and weighted average of 35.4%. Similarly, the statistical analysis conducted on geographies consisting of 118,968,853 people shows a poor negative correlation between the proportion of Immigrants from Sudan and percentage of population with at least bachelor's degree education in the United States with a correlation coefficient (R) of -0.180 and weighted average of 39.4%, a difference of 11.3%.
Bachelor's Degree Correlation Summary
| Measurement | Ecuadorian | Immigrants from Sudan |
| Minimum | 10.6% | 5.7% |
| Maximum | 53.9% | 69.4% |
| Range | 43.3% | 63.7% |
| Mean | 30.9% | 35.5% |
| Median | 33.1% | 35.7% |
| Interquartile 25% (IQ1) | 25.3% | 28.1% |
| Interquartile 75% (IQ3) | 37.4% | 44.0% |
| Interquartile Range (IQR) | 12.1% | 15.8% |
| Standard Deviation (Sample) | 8.9% | 13.6% |
| Standard Deviation (Population) | 8.8% | 13.4% |
Similar Demographics by Bachelor's Degree
Demographics Similar to Ecuadorians by Bachelor's Degree
In terms of bachelor's degree, the demographic groups most similar to Ecuadorians are Immigrants from Trinidad and Tobago (35.3%, a difference of 0.23%), Portuguese (35.5%, a difference of 0.26%), Immigrants from Burma/Myanmar (35.5%, a difference of 0.30%), White/Caucasian (35.3%, a difference of 0.31%), and Immigrants from Barbados (35.5%, a difference of 0.37%).
| Demographics | Rating | Rank | Bachelor's Degree |
| Spanish | 9.6 /100 | #220 | Tragic 35.8% |
| Dutch | 9.2 /100 | #221 | Tragic 35.7% |
| Trinidadians and Tobagonians | 8.8 /100 | #222 | Tragic 35.7% |
| French Canadians | 8.3 /100 | #223 | Tragic 35.6% |
| Immigrants | Barbados | 7.5 /100 | #224 | Tragic 35.5% |
| Immigrants | Burma/Myanmar | 7.3 /100 | #225 | Tragic 35.5% |
| Portuguese | 7.2 /100 | #226 | Tragic 35.5% |
| Ecuadorians | 6.6 /100 | #227 | Tragic 35.4% |
| Immigrants | Trinidad and Tobago | 6.0 /100 | #228 | Tragic 35.3% |
| Whites/Caucasians | 5.9 /100 | #229 | Tragic 35.3% |
| Immigrants | Grenada | 4.3 /100 | #230 | Tragic 35.0% |
| Immigrants | St. Vincent and the Grenadines | 4.3 /100 | #231 | Tragic 35.0% |
| Hmong | 3.4 /100 | #232 | Tragic 34.8% |
| Immigrants | Ecuador | 3.3 /100 | #233 | Tragic 34.7% |
| Guamanians/Chamorros | 3.0 /100 | #234 | Tragic 34.6% |
Demographics Similar to Immigrants from Sudan by Bachelor's Degree
In terms of bachelor's degree, the demographic groups most similar to Immigrants from Sudan are Immigrants from Armenia (39.4%, a difference of 0.070%), South American Indian (39.3%, a difference of 0.16%), European (39.5%, a difference of 0.20%), Icelander (39.5%, a difference of 0.37%), and Immigrants from North Macedonia (39.2%, a difference of 0.48%).
| Demographics | Rating | Rank | Bachelor's Degree |
| Taiwanese | 91.1 /100 | #132 | Exceptional 40.0% |
| Immigrants | Southern Europe | 91.1 /100 | #133 | Exceptional 40.0% |
| Assyrians/Chaldeans/Syriacs | 89.4 /100 | #134 | Excellent 39.8% |
| Luxembourgers | 89.1 /100 | #135 | Excellent 39.8% |
| Pakistanis | 88.2 /100 | #136 | Excellent 39.7% |
| Icelanders | 86.5 /100 | #137 | Excellent 39.5% |
| Europeans | 85.6 /100 | #138 | Excellent 39.5% |
| Immigrants | Sudan | 84.5 /100 | #139 | Excellent 39.4% |
| Immigrants | Armenia | 84.1 /100 | #140 | Excellent 39.4% |
| South American Indians | 83.6 /100 | #141 | Excellent 39.3% |
| Immigrants | North Macedonia | 81.6 /100 | #142 | Excellent 39.2% |
| Poles | 79.8 /100 | #143 | Good 39.1% |
| Immigrants | Afghanistan | 79.7 /100 | #144 | Good 39.1% |
| Slovenes | 79.5 /100 | #145 | Good 39.1% |
| Swedes | 79.2 /100 | #146 | Good 39.1% |