Ecuadorian vs Comanche Nursery School
COMPARE
Ecuadorian
Comanche
Nursery School
Nursery School Comparison
Ecuadorians
Comanche
97.1%
NURSERY SCHOOL
0.0/ 100
METRIC RATING
304th/ 347
METRIC RANK
98.0%
NURSERY SCHOOL
66.0/ 100
METRIC RATING
157th/ 347
METRIC RANK
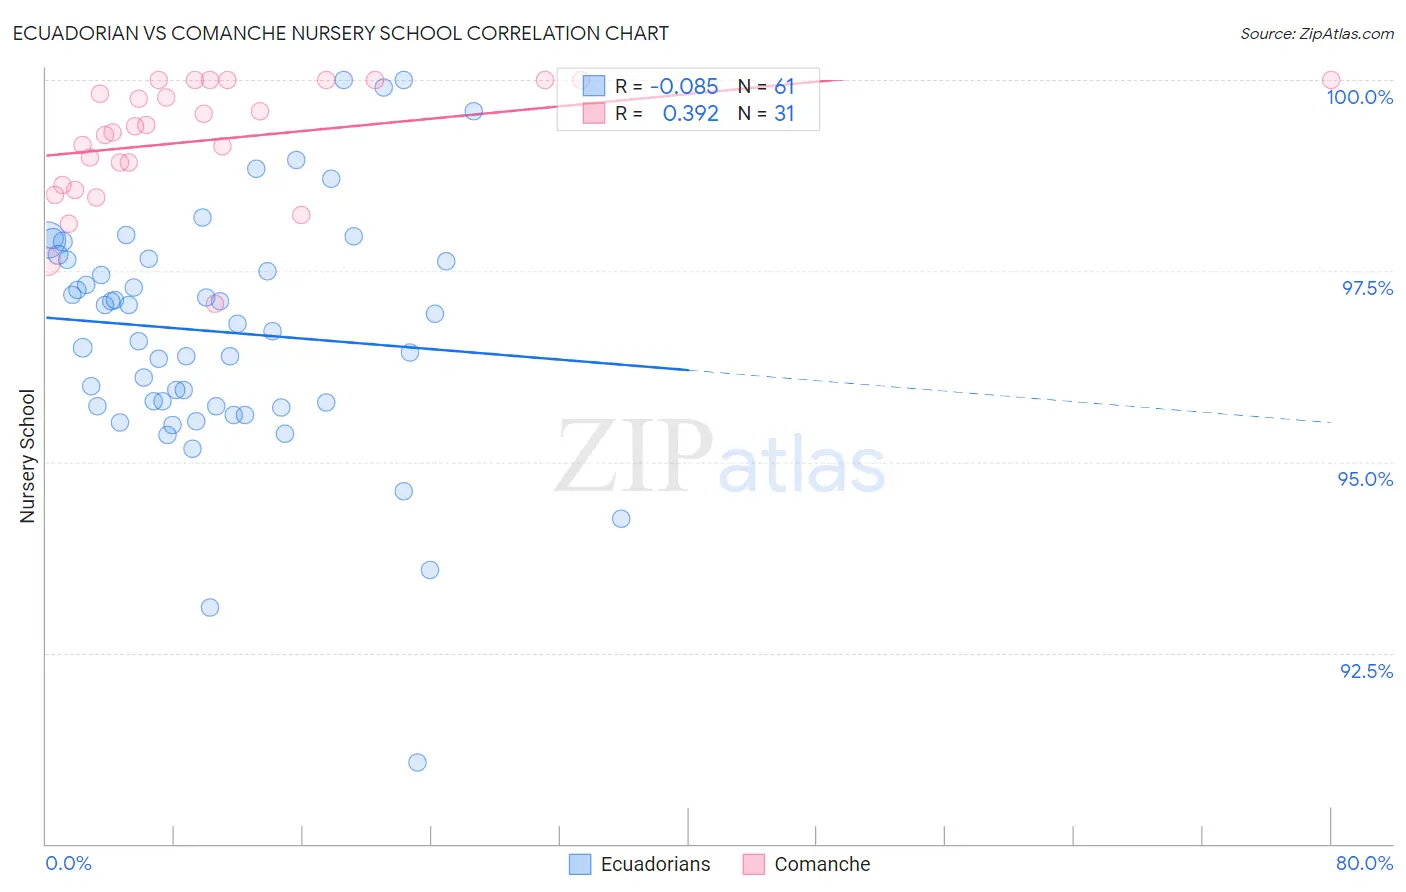
Ecuadorian vs Comanche Nursery School Correlation Chart
The statistical analysis conducted on geographies consisting of 317,865,723 people shows a slight negative correlation between the proportion of Ecuadorians and percentage of population with at least nursery school education in the United States with a correlation coefficient (R) of -0.085 and weighted average of 97.1%. Similarly, the statistical analysis conducted on geographies consisting of 109,786,530 people shows a mild positive correlation between the proportion of Comanche and percentage of population with at least nursery school education in the United States with a correlation coefficient (R) of 0.392 and weighted average of 98.0%, a difference of 0.99%.
Nursery School Correlation Summary
| Measurement | Ecuadorian | Comanche |
| Minimum | 91.1% | 97.1% |
| Maximum | 100.0% | 100.0% |
| Range | 8.9% | 2.9% |
| Mean | 96.7% | 99.2% |
| Median | 96.8% | 99.4% |
| Interquartile 25% (IQ1) | 95.7% | 98.6% |
| Interquartile 75% (IQ3) | 97.7% | 100.0% |
| Interquartile Range (IQR) | 1.9% | 1.4% |
| Standard Deviation (Sample) | 1.6% | 0.78% |
| Standard Deviation (Population) | 1.6% | 0.77% |
Similar Demographics by Nursery School
Demographics Similar to Ecuadorians by Nursery School
In terms of nursery school, the demographic groups most similar to Ecuadorians are Somali (97.1%, a difference of 0.0%), Nicaraguan (97.1%, a difference of 0.010%), Immigrants from Caribbean (97.1%, a difference of 0.040%), Belizean (97.0%, a difference of 0.060%), and Immigrants from South Eastern Asia (97.1%, a difference of 0.070%).
| Demographics | Rating | Rank | Nursery School |
| Immigrants | Cuba | 0.0 /100 | #297 | Tragic 97.2% |
| Central American Indians | 0.0 /100 | #298 | Tragic 97.2% |
| Immigrants | Dominica | 0.0 /100 | #299 | Tragic 97.2% |
| Haitians | 0.0 /100 | #300 | Tragic 97.2% |
| Immigrants | South Eastern Asia | 0.0 /100 | #301 | Tragic 97.1% |
| Immigrants | Caribbean | 0.0 /100 | #302 | Tragic 97.1% |
| Nicaraguans | 0.0 /100 | #303 | Tragic 97.1% |
| Ecuadorians | 0.0 /100 | #304 | Tragic 97.1% |
| Somalis | 0.0 /100 | #305 | Tragic 97.1% |
| Belizeans | 0.0 /100 | #306 | Tragic 97.0% |
| Hispanics or Latinos | 0.0 /100 | #307 | Tragic 97.0% |
| Immigrants | Haiti | 0.0 /100 | #308 | Tragic 97.0% |
| Immigrants | Somalia | 0.0 /100 | #309 | Tragic 97.0% |
| Guyanese | 0.0 /100 | #310 | Tragic 97.0% |
| Immigrants | Azores | 0.0 /100 | #311 | Tragic 97.0% |
Demographics Similar to Comanche by Nursery School
In terms of nursery school, the demographic groups most similar to Comanche are Immigrants from South Central Asia (98.0%, a difference of 0.0%), Venezuelan (98.0%, a difference of 0.0%), Immigrants from North Macedonia (98.0%, a difference of 0.0%), Dutch West Indian (98.0%, a difference of 0.010%), and Immigrants from Moldova (98.0%, a difference of 0.010%).
| Demographics | Rating | Rank | Nursery School |
| Jordanians | 72.9 /100 | #150 | Good 98.1% |
| Soviet Union | 71.6 /100 | #151 | Good 98.0% |
| Dutch West Indians | 70.2 /100 | #152 | Good 98.0% |
| Immigrants | Moldova | 69.6 /100 | #153 | Good 98.0% |
| Immigrants | Iran | 68.7 /100 | #154 | Good 98.0% |
| Immigrants | South Central Asia | 66.7 /100 | #155 | Good 98.0% |
| Venezuelans | 66.6 /100 | #156 | Good 98.0% |
| Comanche | 66.0 /100 | #157 | Good 98.0% |
| Immigrants | North Macedonia | 65.7 /100 | #158 | Good 98.0% |
| French American Indians | 62.1 /100 | #159 | Good 98.0% |
| Immigrants | Russia | 59.9 /100 | #160 | Average 98.0% |
| Immigrants | Eastern Europe | 59.7 /100 | #161 | Average 98.0% |
| Brazilians | 59.4 /100 | #162 | Average 98.0% |
| Immigrants | Italy | 59.0 /100 | #163 | Average 98.0% |
| Ugandans | 56.4 /100 | #164 | Average 98.0% |