Ecuadorian vs Alsatian No Schooling Completed
COMPARE
Ecuadorian
Alsatian
No Schooling Completed
No Schooling Completed Comparison
Ecuadorians
Alsatians
3.0%
NO SCHOOLING COMPLETED
0.0/ 100
METRIC RATING
305th/ 347
METRIC RANK
2.0%
NO SCHOOLING COMPLETED
79.1/ 100
METRIC RATING
144th/ 347
METRIC RANK
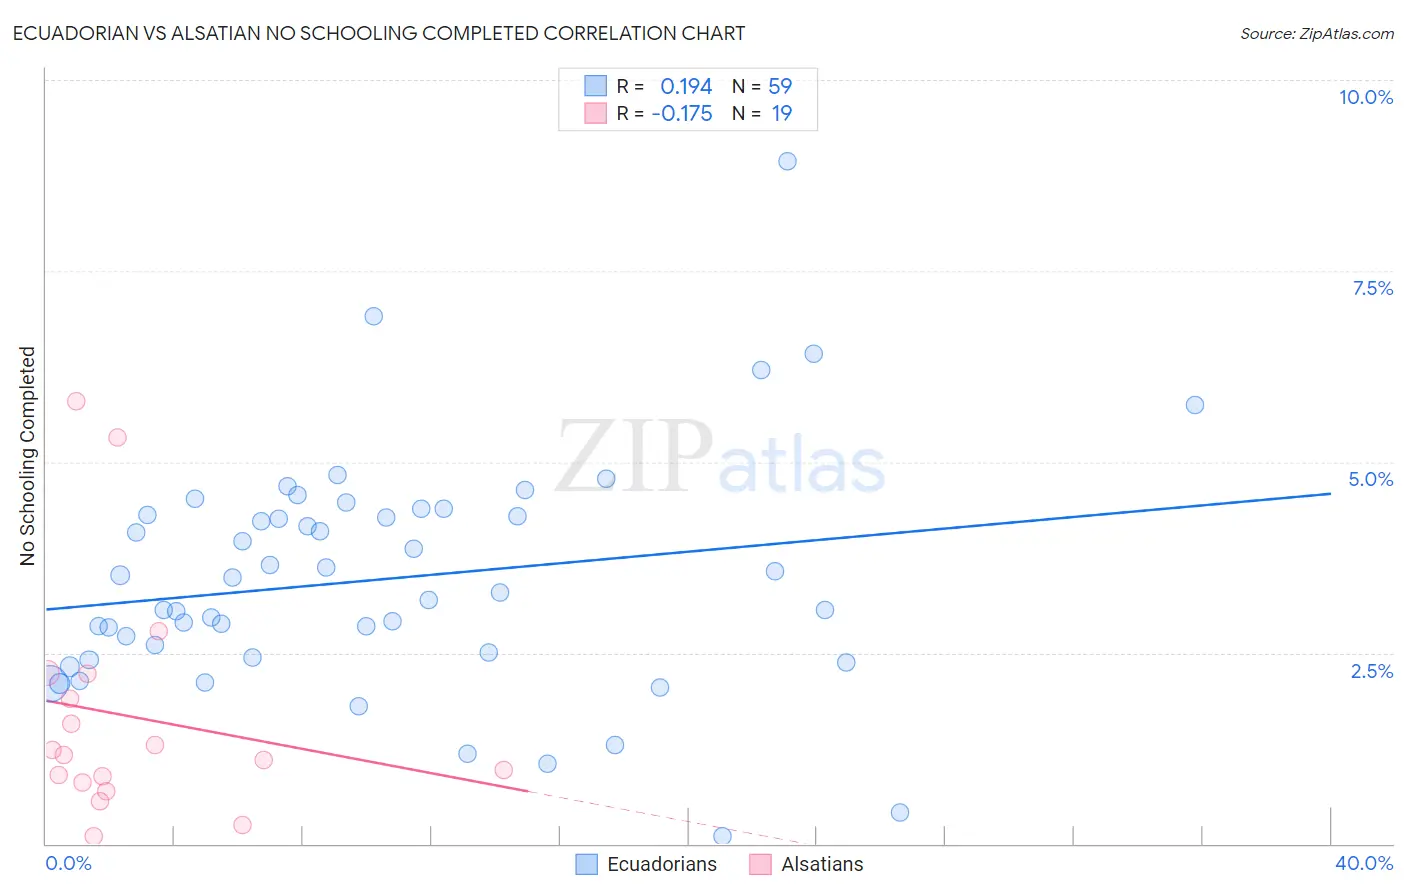
Ecuadorian vs Alsatian No Schooling Completed Correlation Chart
The statistical analysis conducted on geographies consisting of 315,790,309 people shows a poor positive correlation between the proportion of Ecuadorians and percentage of population with no schooling in the United States with a correlation coefficient (R) of 0.194 and weighted average of 3.0%. Similarly, the statistical analysis conducted on geographies consisting of 82,371,288 people shows a poor negative correlation between the proportion of Alsatians and percentage of population with no schooling in the United States with a correlation coefficient (R) of -0.175 and weighted average of 2.0%, a difference of 47.9%.
No Schooling Completed Correlation Summary
| Measurement | Ecuadorian | Alsatian |
| Minimum | 0.10% | 0.10% |
| Maximum | 8.9% | 5.8% |
| Range | 8.8% | 5.7% |
| Mean | 3.5% | 1.7% |
| Median | 3.3% | 1.2% |
| Interquartile 25% (IQ1) | 2.4% | 0.80% |
| Interquartile 75% (IQ3) | 4.3% | 2.2% |
| Interquartile Range (IQR) | 1.9% | 1.4% |
| Standard Deviation (Sample) | 1.5% | 1.5% |
| Standard Deviation (Population) | 1.5% | 1.5% |
Similar Demographics by No Schooling Completed
Demographics Similar to Ecuadorians by No Schooling Completed
In terms of no schooling completed, the demographic groups most similar to Ecuadorians are Nicaraguan (2.9%, a difference of 0.47%), Somali (2.9%, a difference of 0.66%), Immigrants from Caribbean (2.9%, a difference of 1.7%), Belizean (3.0%, a difference of 1.7%), and Immigrants from Haiti (3.0%, a difference of 1.7%).
| Demographics | Rating | Rank | No Schooling Completed |
| Immigrants | Dominica | 0.0 /100 | #298 | Tragic 2.8% |
| Central American Indians | 0.0 /100 | #299 | Tragic 2.8% |
| Haitians | 0.0 /100 | #300 | Tragic 2.9% |
| Immigrants | South Eastern Asia | 0.0 /100 | #301 | Tragic 2.9% |
| Immigrants | Caribbean | 0.0 /100 | #302 | Tragic 2.9% |
| Somalis | 0.0 /100 | #303 | Tragic 2.9% |
| Nicaraguans | 0.0 /100 | #304 | Tragic 2.9% |
| Ecuadorians | 0.0 /100 | #305 | Tragic 3.0% |
| Belizeans | 0.0 /100 | #306 | Tragic 3.0% |
| Immigrants | Haiti | 0.0 /100 | #307 | Tragic 3.0% |
| Immigrants | Somalia | 0.0 /100 | #308 | Tragic 3.0% |
| Hispanics or Latinos | 0.0 /100 | #309 | Tragic 3.0% |
| Guyanese | 0.0 /100 | #310 | Tragic 3.0% |
| Immigrants | Azores | 0.0 /100 | #311 | Tragic 3.0% |
| Sri Lankans | 0.0 /100 | #312 | Tragic 3.0% |
Demographics Similar to Alsatians by No Schooling Completed
In terms of no schooling completed, the demographic groups most similar to Alsatians are Immigrants from Iran (2.0%, a difference of 0.010%), Immigrants from South Central Asia (2.0%, a difference of 0.20%), Immigrants from Moldova (2.0%, a difference of 0.22%), Soviet Union (2.0%, a difference of 0.40%), and Shoshone (2.0%, a difference of 0.48%).
| Demographics | Rating | Rank | No Schooling Completed |
| Filipinos | 85.5 /100 | #137 | Excellent 2.0% |
| Immigrants | Israel | 85.4 /100 | #138 | Excellent 2.0% |
| Jordanians | 84.5 /100 | #139 | Excellent 2.0% |
| Marshallese | 83.5 /100 | #140 | Excellent 2.0% |
| Immigrants | Greece | 83.5 /100 | #141 | Excellent 2.0% |
| Venezuelans | 81.5 /100 | #142 | Excellent 2.0% |
| Immigrants | South Central Asia | 80.0 /100 | #143 | Good 2.0% |
| Alsatians | 79.1 /100 | #144 | Good 2.0% |
| Immigrants | Iran | 79.0 /100 | #145 | Good 2.0% |
| Immigrants | Moldova | 78.0 /100 | #146 | Good 2.0% |
| Soviet Union | 77.1 /100 | #147 | Good 2.0% |
| Shoshone | 76.7 /100 | #148 | Good 2.0% |
| Immigrants | North Macedonia | 75.9 /100 | #149 | Good 2.0% |
| Blackfeet | 72.9 /100 | #150 | Good 2.0% |
| Immigrants | Jordan | 70.9 /100 | #151 | Good 2.0% |