Eastern European vs Immigrants from Croatia 6th Grade
COMPARE
Eastern European
Immigrants from Croatia
6th Grade
6th Grade Comparison
Eastern Europeans
Immigrants from Croatia
97.9%
6TH GRADE
99.9/ 100
METRIC RATING
41st/ 347
METRIC RANK
97.3%
6TH GRADE
93.1/ 100
METRIC RATING
127th/ 347
METRIC RANK
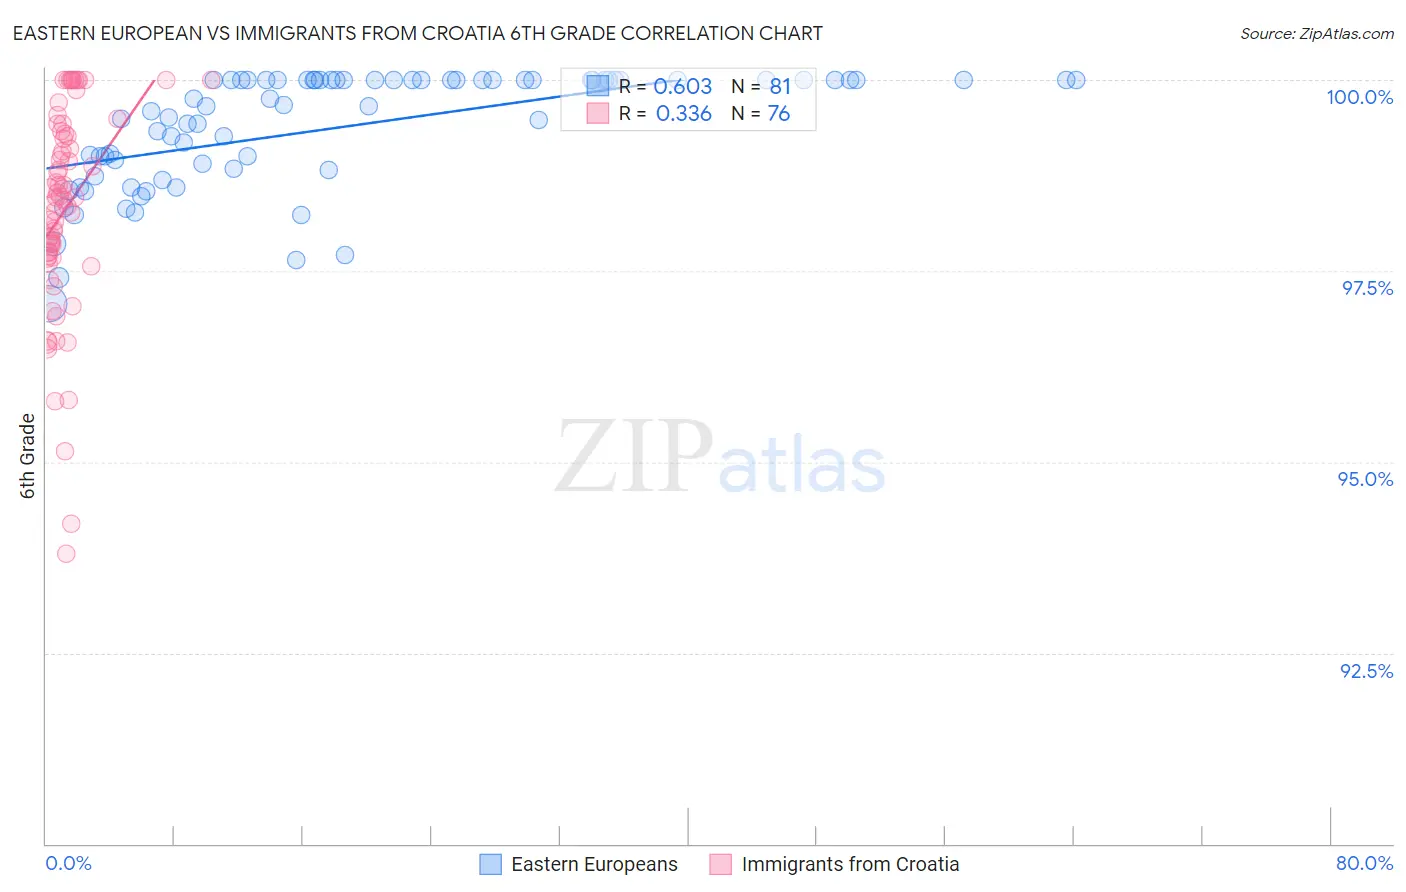
Eastern European vs Immigrants from Croatia 6th Grade Correlation Chart
The statistical analysis conducted on geographies consisting of 461,244,590 people shows a significant positive correlation between the proportion of Eastern Europeans and percentage of population with at least 6th grade education in the United States with a correlation coefficient (R) of 0.603 and weighted average of 97.9%. Similarly, the statistical analysis conducted on geographies consisting of 132,547,821 people shows a mild positive correlation between the proportion of Immigrants from Croatia and percentage of population with at least 6th grade education in the United States with a correlation coefficient (R) of 0.336 and weighted average of 97.3%, a difference of 0.53%.
6th Grade Correlation Summary
| Measurement | Eastern European | Immigrants from Croatia |
| Minimum | 97.1% | 93.8% |
| Maximum | 100.0% | 100.0% |
| Range | 2.9% | 6.2% |
| Mean | 99.4% | 98.3% |
| Median | 99.7% | 98.5% |
| Interquartile 25% (IQ1) | 98.8% | 97.7% |
| Interquartile 75% (IQ3) | 100.0% | 99.3% |
| Interquartile Range (IQR) | 1.2% | 1.6% |
| Standard Deviation (Sample) | 0.76% | 1.4% |
| Standard Deviation (Population) | 0.75% | 1.4% |
Similar Demographics by 6th Grade
Demographics Similar to Eastern Europeans by 6th Grade
In terms of 6th grade, the demographic groups most similar to Eastern Europeans are Hungarian (97.8%, a difference of 0.010%), Northern European (97.8%, a difference of 0.020%), Latvian (97.9%, a difference of 0.030%), Belgian (97.9%, a difference of 0.040%), and Luxembourger (97.9%, a difference of 0.040%).
| Demographics | Rating | Rank | 6th Grade |
| Swiss | 100.0 /100 | #34 | Exceptional 97.9% |
| Chinese | 100.0 /100 | #35 | Exceptional 97.9% |
| Italians | 100.0 /100 | #36 | Exceptional 97.9% |
| British | 100.0 /100 | #37 | Exceptional 97.9% |
| Belgians | 100.0 /100 | #38 | Exceptional 97.9% |
| Luxembourgers | 99.9 /100 | #39 | Exceptional 97.9% |
| Latvians | 99.9 /100 | #40 | Exceptional 97.9% |
| Eastern Europeans | 99.9 /100 | #41 | Exceptional 97.9% |
| Hungarians | 99.9 /100 | #42 | Exceptional 97.8% |
| Northern Europeans | 99.9 /100 | #43 | Exceptional 97.8% |
| Czechoslovakians | 99.9 /100 | #44 | Exceptional 97.8% |
| Bulgarians | 99.9 /100 | #45 | Exceptional 97.8% |
| Arapaho | 99.9 /100 | #46 | Exceptional 97.8% |
| Native Hawaiians | 99.9 /100 | #47 | Exceptional 97.8% |
| Celtics | 99.9 /100 | #48 | Exceptional 97.8% |
Demographics Similar to Immigrants from Croatia by 6th Grade
In terms of 6th grade, the demographic groups most similar to Immigrants from Croatia are Spanish (97.3%, a difference of 0.010%), Immigrants from Bulgaria (97.3%, a difference of 0.010%), Hmong (97.4%, a difference of 0.020%), Okinawan (97.4%, a difference of 0.020%), and Immigrants from Romania (97.3%, a difference of 0.020%).
| Demographics | Rating | Rank | 6th Grade |
| Syrians | 94.8 /100 | #120 | Exceptional 97.4% |
| Immigrants | Norway | 94.7 /100 | #121 | Exceptional 97.4% |
| Immigrants | France | 94.5 /100 | #122 | Exceptional 97.4% |
| Hmong | 94.4 /100 | #123 | Exceptional 97.4% |
| Okinawans | 94.2 /100 | #124 | Exceptional 97.4% |
| Spanish | 93.7 /100 | #125 | Exceptional 97.3% |
| Immigrants | Bulgaria | 93.6 /100 | #126 | Exceptional 97.3% |
| Immigrants | Croatia | 93.1 /100 | #127 | Exceptional 97.3% |
| Immigrants | Romania | 92.0 /100 | #128 | Exceptional 97.3% |
| Immigrants | Serbia | 91.9 /100 | #129 | Exceptional 97.3% |
| Cambodians | 91.8 /100 | #130 | Exceptional 97.3% |
| Immigrants | Europe | 91.1 /100 | #131 | Exceptional 97.3% |
| Palestinians | 90.9 /100 | #132 | Exceptional 97.3% |
| Immigrants | Moldova | 90.0 /100 | #133 | Excellent 97.3% |
| Immigrants | Kuwait | 89.5 /100 | #134 | Excellent 97.3% |