Dutch West Indian vs Paraguayan 8th Grade
COMPARE
Dutch West Indian
Paraguayan
8th Grade
8th Grade Comparison
Dutch West Indians
Paraguayans
95.4%
8TH GRADE
8.1/ 100
METRIC RATING
218th/ 347
METRIC RANK
95.5%
8TH GRADE
22.6/ 100
METRIC RATING
198th/ 347
METRIC RANK
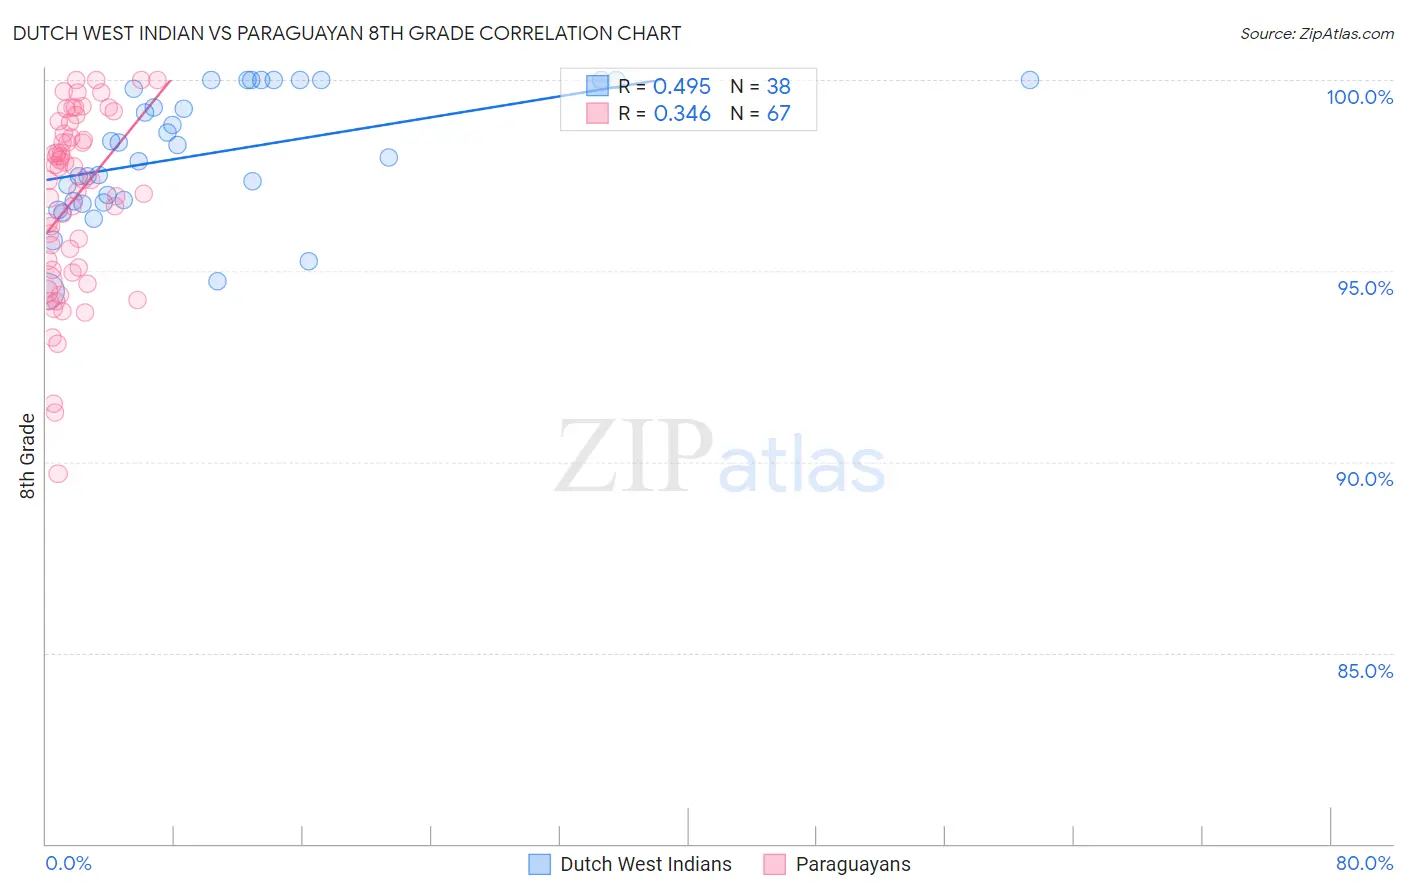
Dutch West Indian vs Paraguayan 8th Grade Correlation Chart
The statistical analysis conducted on geographies consisting of 85,775,604 people shows a moderate positive correlation between the proportion of Dutch West Indians and percentage of population with at least 8th grade education in the United States with a correlation coefficient (R) of 0.495 and weighted average of 95.4%. Similarly, the statistical analysis conducted on geographies consisting of 95,113,577 people shows a mild positive correlation between the proportion of Paraguayans and percentage of population with at least 8th grade education in the United States with a correlation coefficient (R) of 0.346 and weighted average of 95.5%, a difference of 0.20%.
8th Grade Correlation Summary
| Measurement | Dutch West Indian | Paraguayan |
| Minimum | 94.5% | 89.7% |
| Maximum | 100.0% | 100.0% |
| Range | 5.5% | 10.3% |
| Mean | 98.1% | 96.8% |
| Median | 98.1% | 97.4% |
| Interquartile 25% (IQ1) | 96.8% | 95.0% |
| Interquartile 75% (IQ3) | 100.0% | 98.6% |
| Interquartile Range (IQR) | 3.2% | 3.6% |
| Standard Deviation (Sample) | 1.6% | 2.3% |
| Standard Deviation (Population) | 1.6% | 2.3% |
Demographics Similar to Dutch West Indians and Paraguayans by 8th Grade
In terms of 8th grade, the demographic groups most similar to Dutch West Indians are Immigrants from Eastern Asia (95.4%, a difference of 0.0%), Samoan (95.4%, a difference of 0.010%), Laotian (95.4%, a difference of 0.020%), Immigrants from Chile (95.4%, a difference of 0.020%), and Immigrants from Liberia (95.4%, a difference of 0.020%). Similarly, the demographic groups most similar to Paraguayans are Immigrants from Northern Africa (95.5%, a difference of 0.0%), Argentinean (95.5%, a difference of 0.0%), Immigrants from Argentina (95.5%, a difference of 0.020%), Apache (95.5%, a difference of 0.030%), and Moroccan (95.5%, a difference of 0.050%).
| Demographics | Rating | Rank | 8th Grade |
| Paraguayans | 22.6 /100 | #198 | Fair 95.5% |
| Immigrants | Northern Africa | 22.5 /100 | #199 | Fair 95.5% |
| Argentineans | 22.2 /100 | #200 | Fair 95.5% |
| Immigrants | Argentina | 20.6 /100 | #201 | Fair 95.5% |
| Apache | 19.4 /100 | #202 | Poor 95.5% |
| Moroccans | 17.4 /100 | #203 | Poor 95.5% |
| Hawaiians | 16.7 /100 | #204 | Poor 95.5% |
| Immigrants | Bahamas | 16.7 /100 | #205 | Poor 95.5% |
| Comanche | 16.3 /100 | #206 | Poor 95.5% |
| Immigrants | Sudan | 15.1 /100 | #207 | Poor 95.5% |
| Portuguese | 14.3 /100 | #208 | Poor 95.5% |
| Immigrants | Lebanon | 13.7 /100 | #209 | Poor 95.4% |
| Africans | 13.6 /100 | #210 | Poor 95.4% |
| Immigrants | Morocco | 12.4 /100 | #211 | Poor 95.4% |
| Immigrants | Pakistan | 9.7 /100 | #212 | Tragic 95.4% |
| Laotians | 9.0 /100 | #213 | Tragic 95.4% |
| Immigrants | Chile | 9.0 /100 | #214 | Tragic 95.4% |
| Immigrants | Liberia | 8.9 /100 | #215 | Tragic 95.4% |
| Samoans | 8.4 /100 | #216 | Tragic 95.4% |
| Immigrants | Eastern Asia | 8.3 /100 | #217 | Tragic 95.4% |
| Dutch West Indians | 8.1 /100 | #218 | Tragic 95.4% |