Dutch West Indian vs Navajo College, Under 1 year
COMPARE
Dutch West Indian
Navajo
College, Under 1 year
College, Under 1 year Comparison
Dutch West Indians
Navajo
57.2%
COLLEGE, UNDER 1 YEAR
0.0/ 100
METRIC RATING
313th/ 347
METRIC RANK
56.3%
COLLEGE, UNDER 1 YEAR
0.0/ 100
METRIC RATING
326th/ 347
METRIC RANK
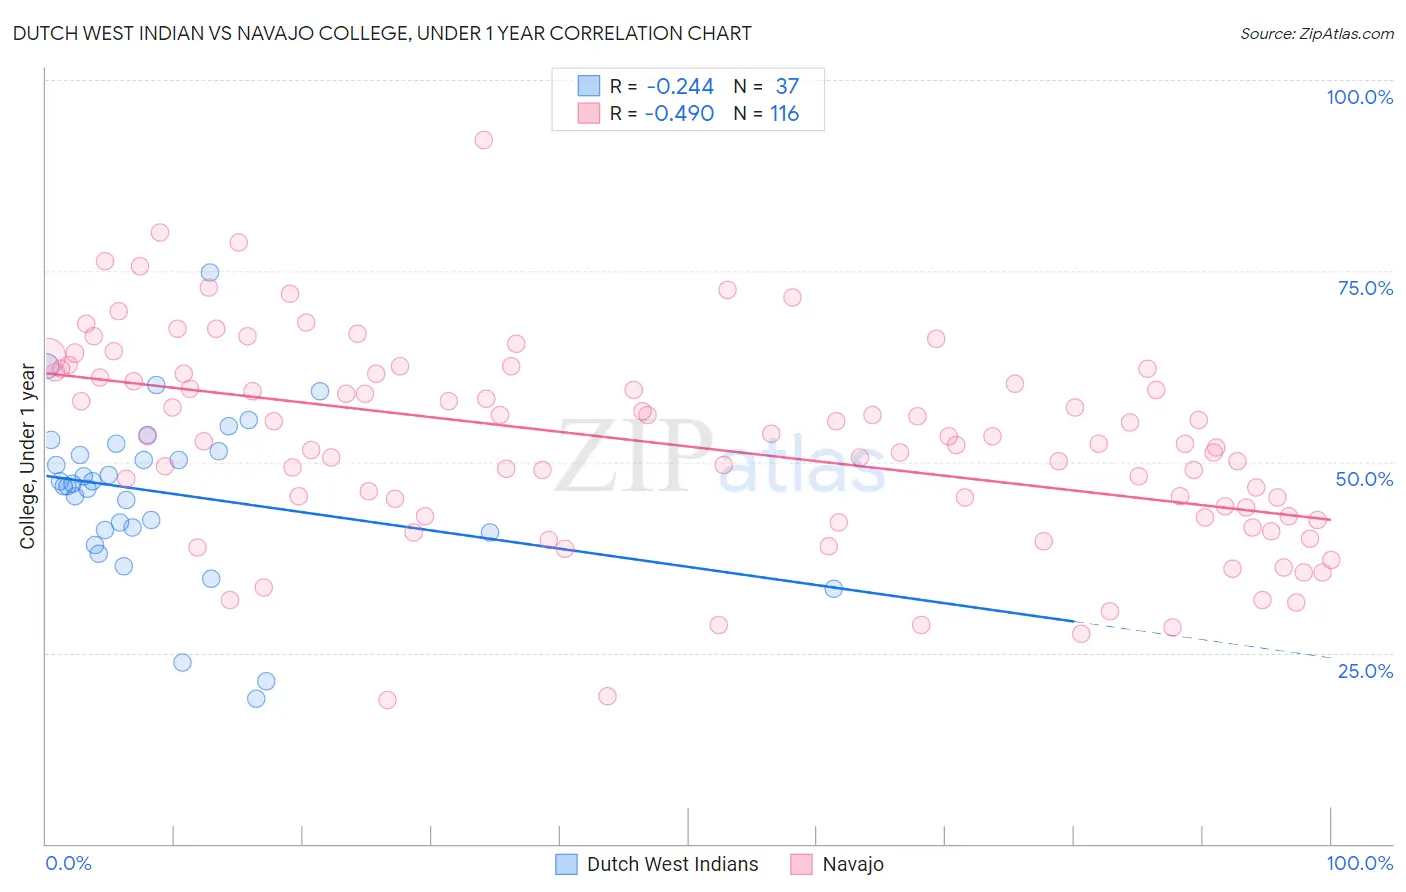
Dutch West Indian vs Navajo College, Under 1 year Correlation Chart
The statistical analysis conducted on geographies consisting of 85,776,067 people shows a weak negative correlation between the proportion of Dutch West Indians and percentage of population with at least college, under 1 year education in the United States with a correlation coefficient (R) of -0.244 and weighted average of 57.2%. Similarly, the statistical analysis conducted on geographies consisting of 224,872,431 people shows a moderate negative correlation between the proportion of Navajo and percentage of population with at least college, under 1 year education in the United States with a correlation coefficient (R) of -0.490 and weighted average of 56.3%, a difference of 1.6%.
College, Under 1 year Correlation Summary
| Measurement | Dutch West Indian | Navajo |
| Minimum | 19.0% | 18.9% |
| Maximum | 74.8% | 92.2% |
| Range | 55.8% | 73.3% |
| Mean | 45.9% | 52.4% |
| Median | 47.1% | 52.5% |
| Interquartile 25% (IQ1) | 40.9% | 42.9% |
| Interquartile 75% (IQ3) | 51.9% | 61.6% |
| Interquartile Range (IQR) | 11.1% | 18.7% |
| Standard Deviation (Sample) | 11.0% | 13.3% |
| Standard Deviation (Population) | 10.8% | 13.2% |
Demographics Similar to Dutch West Indians and Navajo by College, Under 1 year
In terms of college, under 1 year, the demographic groups most similar to Dutch West Indians are Hopi (57.1%, a difference of 0.12%), Honduran (57.1%, a difference of 0.16%), Menominee (57.0%, a difference of 0.22%), Salvadoran (57.3%, a difference of 0.24%), and Hispanic or Latino (57.0%, a difference of 0.26%). Similarly, the demographic groups most similar to Navajo are Immigrants from Guatemala (56.2%, a difference of 0.090%), Immigrants from Latin America (56.3%, a difference of 0.15%), Immigrants from El Salvador (56.4%, a difference of 0.25%), Immigrants from Honduras (56.5%, a difference of 0.38%), and Cape Verdean (56.0%, a difference of 0.38%).
| Demographics | Rating | Rank | College, Under 1 year |
| Immigrants | Nicaragua | 0.0 /100 | #309 | Tragic 57.6% |
| Pueblo | 0.0 /100 | #310 | Tragic 57.4% |
| Cajuns | 0.0 /100 | #311 | Tragic 57.3% |
| Salvadorans | 0.0 /100 | #312 | Tragic 57.3% |
| Dutch West Indians | 0.0 /100 | #313 | Tragic 57.2% |
| Hopi | 0.0 /100 | #314 | Tragic 57.1% |
| Hondurans | 0.0 /100 | #315 | Tragic 57.1% |
| Menominee | 0.0 /100 | #316 | Tragic 57.0% |
| Hispanics or Latinos | 0.0 /100 | #317 | Tragic 57.0% |
| Immigrants | Haiti | 0.0 /100 | #318 | Tragic 56.9% |
| Puerto Ricans | 0.0 /100 | #319 | Tragic 56.8% |
| Guatemalans | 0.0 /100 | #320 | Tragic 56.8% |
| Natives/Alaskans | 0.0 /100 | #321 | Tragic 56.6% |
| Immigrants | Caribbean | 0.0 /100 | #322 | Tragic 56.6% |
| Immigrants | Honduras | 0.0 /100 | #323 | Tragic 56.5% |
| Immigrants | El Salvador | 0.0 /100 | #324 | Tragic 56.4% |
| Immigrants | Latin America | 0.0 /100 | #325 | Tragic 56.3% |
| Navajo | 0.0 /100 | #326 | Tragic 56.3% |
| Immigrants | Guatemala | 0.0 /100 | #327 | Tragic 56.2% |
| Cape Verdeans | 0.0 /100 | #328 | Tragic 56.0% |
| Immigrants | Cuba | 0.0 /100 | #329 | Tragic 55.7% |