Dutch West Indian vs Inupiat 10th Grade
COMPARE
Dutch West Indian
Inupiat
10th Grade
10th Grade Comparison
Dutch West Indians
Inupiat
92.6%
10TH GRADE
0.4/ 100
METRIC RATING
265th/ 347
METRIC RANK
94.4%
10TH GRADE
95.1/ 100
METRIC RATING
122nd/ 347
METRIC RANK
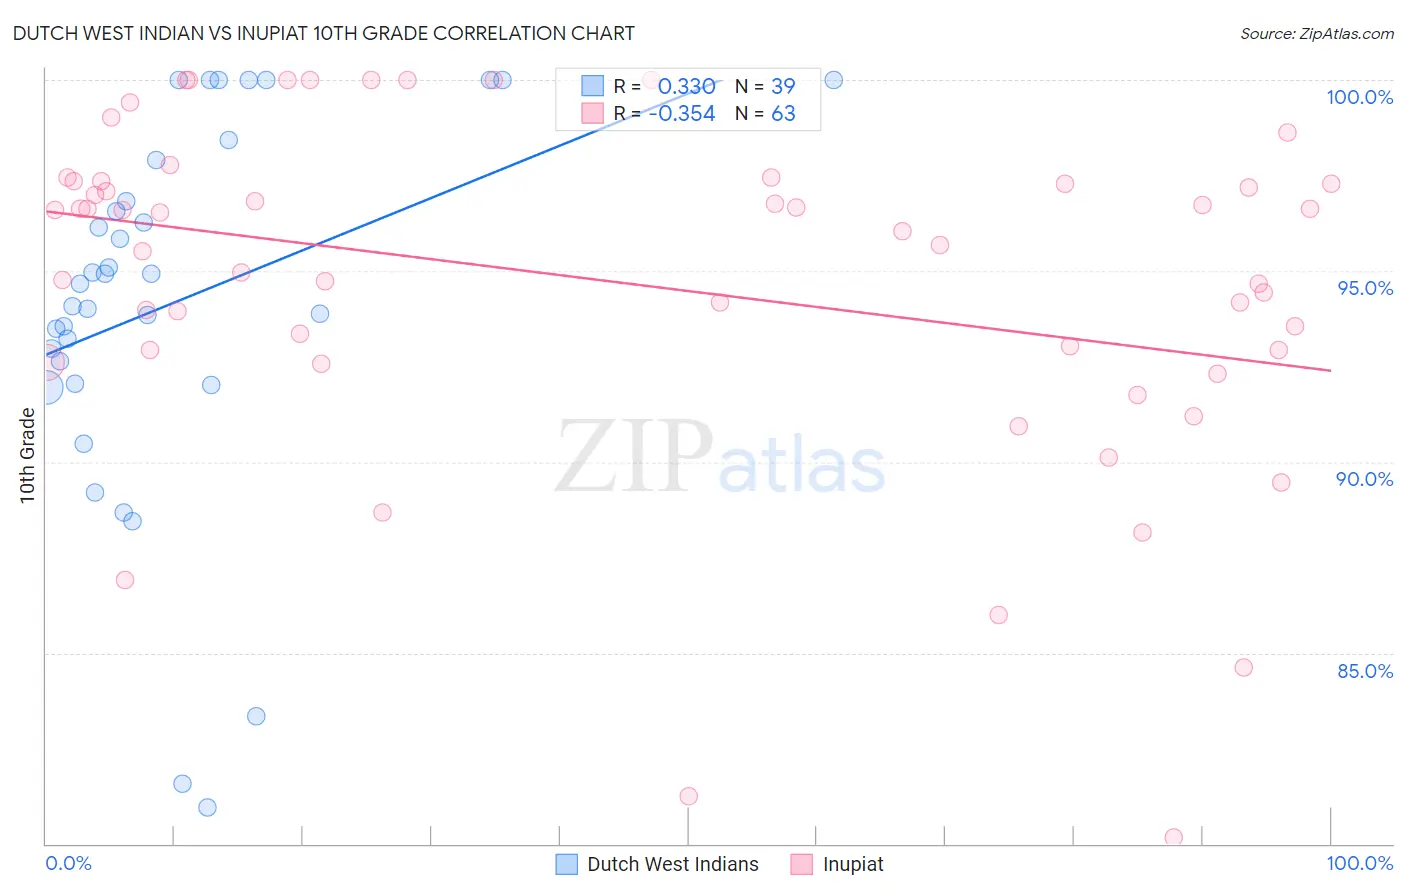
Dutch West Indian vs Inupiat 10th Grade Correlation Chart
The statistical analysis conducted on geographies consisting of 85,776,122 people shows a mild positive correlation between the proportion of Dutch West Indians and percentage of population with at least 10th grade education in the United States with a correlation coefficient (R) of 0.330 and weighted average of 92.6%. Similarly, the statistical analysis conducted on geographies consisting of 96,349,240 people shows a mild negative correlation between the proportion of Inupiat and percentage of population with at least 10th grade education in the United States with a correlation coefficient (R) of -0.354 and weighted average of 94.4%, a difference of 1.9%.
10th Grade Correlation Summary
| Measurement | Dutch West Indian | Inupiat |
| Minimum | 81.0% | 80.2% |
| Maximum | 100.0% | 100.0% |
| Range | 19.0% | 19.8% |
| Mean | 94.2% | 94.7% |
| Median | 94.7% | 96.0% |
| Interquartile 25% (IQ1) | 92.0% | 92.9% |
| Interquartile 75% (IQ3) | 97.9% | 97.3% |
| Interquartile Range (IQR) | 5.9% | 4.4% |
| Standard Deviation (Sample) | 4.9% | 4.4% |
| Standard Deviation (Population) | 4.8% | 4.4% |
Similar Demographics by 10th Grade
Demographics Similar to Dutch West Indians by 10th Grade
In terms of 10th grade, the demographic groups most similar to Dutch West Indians are Immigrants from Philippines (92.6%, a difference of 0.0%), Taiwanese (92.5%, a difference of 0.010%), Immigrants from Ghana (92.5%, a difference of 0.010%), Immigrants from South America (92.6%, a difference of 0.030%), and Apache (92.6%, a difference of 0.030%).
| Demographics | Rating | Rank | 10th Grade |
| Immigrants | Costa Rica | 0.6 /100 | #258 | Tragic 92.7% |
| Immigrants | Jamaica | 0.5 /100 | #259 | Tragic 92.6% |
| Immigrants | Uzbekistan | 0.5 /100 | #260 | Tragic 92.6% |
| Paiute | 0.4 /100 | #261 | Tragic 92.6% |
| Immigrants | South America | 0.4 /100 | #262 | Tragic 92.6% |
| Apache | 0.4 /100 | #263 | Tragic 92.6% |
| Peruvians | 0.4 /100 | #264 | Tragic 92.6% |
| Dutch West Indians | 0.4 /100 | #265 | Tragic 92.6% |
| Immigrants | Philippines | 0.4 /100 | #266 | Tragic 92.6% |
| Taiwanese | 0.3 /100 | #267 | Tragic 92.5% |
| Immigrants | Ghana | 0.3 /100 | #268 | Tragic 92.5% |
| Immigrants | Colombia | 0.3 /100 | #269 | Tragic 92.5% |
| Immigrants | Uruguay | 0.3 /100 | #270 | Tragic 92.5% |
| Immigrants | Eritrea | 0.3 /100 | #271 | Tragic 92.5% |
| Immigrants | Western Africa | 0.3 /100 | #272 | Tragic 92.5% |
Demographics Similar to Inupiat by 10th Grade
In terms of 10th grade, the demographic groups most similar to Inupiat are Immigrants from Belarus (94.4%, a difference of 0.0%), Cree (94.4%, a difference of 0.0%), Immigrants from Israel (94.4%, a difference of 0.010%), Immigrants from Taiwan (94.4%, a difference of 0.010%), and Basque (94.3%, a difference of 0.010%).
| Demographics | Rating | Rank | 10th Grade |
| Delaware | 96.3 /100 | #115 | Exceptional 94.4% |
| Sioux | 96.2 /100 | #116 | Exceptional 94.4% |
| Immigrants | Hungary | 95.8 /100 | #117 | Exceptional 94.4% |
| Jordanians | 95.6 /100 | #118 | Exceptional 94.4% |
| Immigrants | Israel | 95.4 /100 | #119 | Exceptional 94.4% |
| Immigrants | Taiwan | 95.3 /100 | #120 | Exceptional 94.4% |
| Immigrants | Belarus | 95.2 /100 | #121 | Exceptional 94.4% |
| Inupiat | 95.1 /100 | #122 | Exceptional 94.4% |
| Cree | 95.1 /100 | #123 | Exceptional 94.4% |
| Basques | 94.9 /100 | #124 | Exceptional 94.3% |
| Americans | 94.4 /100 | #125 | Exceptional 94.3% |
| Immigrants | Iran | 94.4 /100 | #126 | Exceptional 94.3% |
| Israelis | 93.8 /100 | #127 | Exceptional 94.3% |
| Potawatomi | 93.6 /100 | #128 | Exceptional 94.3% |
| Iroquois | 92.8 /100 | #129 | Exceptional 94.3% |